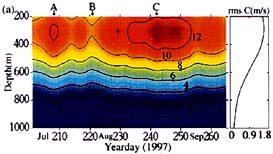
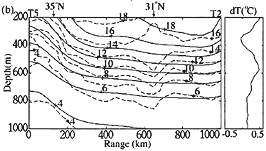
Figure 3.丂(a)丂Time evolution of the range-averaged sound speed anomaly along the path T2-T5 (1000.4 km range, along the T/P track p238) determined by the inversion analysis of the travel time data. The contour interval is 2 m/s. The rms uncertainty for these profiles is shown on the right penel. (b)丂Temperature distributions in the vertical section between stations T2 and T5. Solid lines are constructed from the tomography measurement at 00:00 July 20, 1997 (UTC and dashed lines from the XCTD/CTD hydrocasts done every 50-km during July 20-22, 1997. The contour interval is 2亷. The range-averaged difference dT between the two temperature fields is presented at the right edge of the figure.
丂
A convex lens-shape water mass with a horizontal scale of about 150-km centered at 400 m depth is visible near 31亱N (650 km from station T5) as seen with the isotherms of 14-16亷. This water mass which may be a subsurface warm eddy influences the entire water column. A cold water mass with temperatures less than 4亷 and a depth range of 100 m intrudes into the 400 m layer around station T5.
Three-dimensional fields of temperature anomaly (兟T) calculated by the inverse analysis are shown with the contour plots on various horizontal sections in Figure 4 to emphasize the complicated evolution of the temperature field in both time and space of the tomographic site. The first, second, third and fourth rows correspond to 200, 400, 600 and 1000 m depth sections, respectively. The meandering Kuroshio Extension front is seen along the 2 and 3 亷 idsotherms at both 200 and 400 m depths and makes litile change of position with increasing depth. The Kuroshio meander grows gradually from July 20 (first column) to August 10 (second column), inducing a cold eddy on the right-hand flank of the meander crest. A warm eddy is seen at 30.5亱N, 148亱E, a position that is almost the same as the subsuface eddy in Figure 3, and moves westward with a speed of 5.8 cm/s during the period. The meridional amplitude of the meander reaches a maximum on August 30 (third column). At this time, a new, intense, warm eddy newly appears in the meander crest, forming a pair with the pre-existed cold eddy. The meander decays rapidly with the diminishing of the warm and cold eddies on September 20 (fourth column). A warm eddy reappears in almost the same place as that of the July 20 warm eddy. Temperature anomalies due to the meander and eddies are nearly constant in the upper 400 m and decrease at depths greater than 400 m.