ambient noise is reduced and the influence of a smooth ice cover less than 6m thick is insignificant, see Fig. 6. However, other studies (Fricke, 1993, 1995) have shown that the effect of scattering from an elastic sea ice cover is significant at frequencies below 100 Hz and in forthcoming work it is important to include the effect of ice roughness in the acoustic propagation simulations. So low-frequency long-range propagation can potentially provide sea ice roughness information in addition to the averaged temperature.
In the case of monitoring changes of sea ice thickness/roughness the source has to transmit sound which is sensitive to the sea ice characteristics through the reflection coefficients. Due to the strong surface ducts found in areas of freezing processes and regions already covered by ice, sound above a cutoff frequency (increasing with surface duct depth) is trapped within the duct and interacts repeatedly with the ice cover. At long distances, after several bounces, the sound has been exposed to several reflection losses and scattering losses. In this preliminary study the scattering effect is eliminated by using smooth surfaces, and only the characteristics of specular reflection is included.
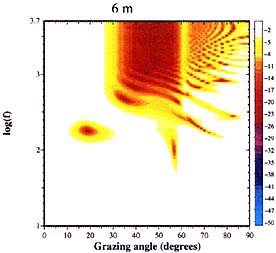
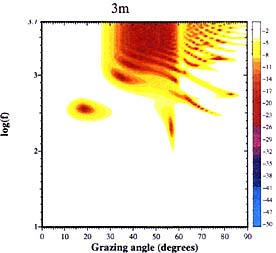
The reflection loss have been calculated as a function of grazing angle (angle relative to the horizontal) and frequency for 6m and 3m ice thickness using typical sound speeds for Arctic ice. The results are plotted in Figure 6 where the white color corresponds to close to total reflection. The reflection loss function with respect to grazing angle depends strongly on the frequency. Below a given frequency the reflection is total at all angles, while above this frequency the losses are introduced at a relatively narrow angle interval close to critical angle of compressional waves. The reflection loss is due to the transmission of acoustic energy into elastic compressional wave in the ice cover. Then in a frequency band the reflection loss increases rapidly for a very broad range of angles down to a minimum grazing angle between 10亱-20亱. This corresponds to transmission of acoustic energy into elastic shear waves in the ice cover.
Fig. 6. Reflection loss calculated for 6m and 3m thick MY ice in the Arctic. Compressional wave speed is 3000m/s, shear wave speed is 1600m/s, attenuation of cc waves ac 0.6dB/兩 and absorption of cs waves (as)1.9dB/兩.
丂
Furthermore, the plots reveals a strong sensitivity in the reflection coefficient function with respect to frequency to changes in ice thickness. Thinner ice moves the whole reflection loss patterm towards higher frequencies without any other changes (Sagen, 1998).