Winter data from 1976 and 1987 have been processed and prepared for use in the AMOC project. These data were collected along a series of submarine tracks in the Arctic Basin and the Fram Strait, but have been divided into 1 degree latitude granules, each containing the following parameters: (1) ice drafts, (2) level ice drafts, (3) rough ice drafts, and (4) leads and polynyas. Ice drafts, level ice drafts and rough ice drafts were all classifies in 0.1m bins, 0-50m range(Wadhams, 1998). Summer data collected by British and US sibmarines in 1996, will also be analysed and prepared for use in the AMOC project.
丂
Task 2: Climate and ice modeling.
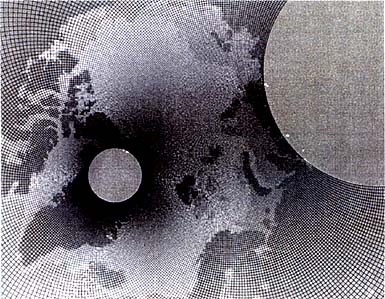
During the first year the main objective is the delivery of time-varying oceanographic sections and the velocity components within and perpendicular to the sections along the proposed sound tracks by use of a general circulation model, HOPE (Hamburg Ocean-model in Primitive Equations). Three requirements for the configuration of the model follow from the basic goals of AMOC: (1) High spatial resolution in the Arctic Ocean, (2) Suitability for multiple medium range (i.e. several decades) runs, and (3) Minimization of erroneous signals that may evolve almost inevitably at open boundaries of regional models. To compromise these requirements we develop a circulation model that is formally global but with strongly enhanced resolution in the region of interest. This is achieved by a conformal shift of the geographical poles to the location "Summit" on Greenland at 77 N and 40 W, and "Tura" at the lower Tunguska at 64 N and 100 E The resolutron around Greenland is approximately 15 km, see Fig. 3.
The model was spun up with climatological forcing of Hellerman-Rosenstein wind stress, COADS atmospheric temperature, and annual mean surface salinity from the LEVITUS atlas to which the model salinity is restored in ice-free parts of the water. It is expected that the model with this forcing will produce a realistic estimate of the natural variability. The output from this model will be analyzed in order to detect the most sensitive regions of the Arctic ocean. Parallel to the tuning and spin-up of the model we started to extract daily forcing fields from the ECMWF anaiyses. Fig. 4 shows sea ice compactness in December year 2010.
Fig. 3.丂Gridlines for the Arctic ocean. The resolution around Greenland is appr. 15 km.