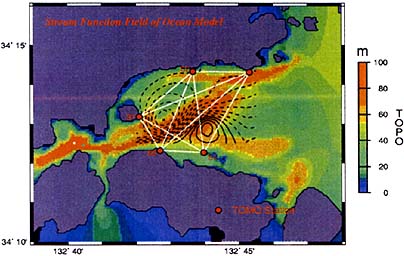
(a)
Ѓ@
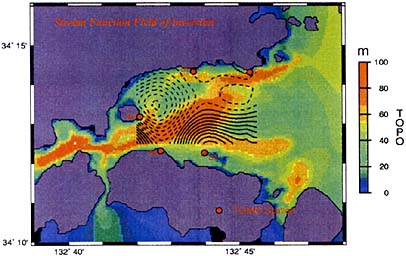
(b)
Fig. 6Ѓ@Contour plots of the stream function (a) for the model and (b) for the inversion. Color Codes present the bottom topography.
BACKЃ@Ѓ@Ѓ@CONTENTSЃ@Ѓ@Ѓ@NEXT