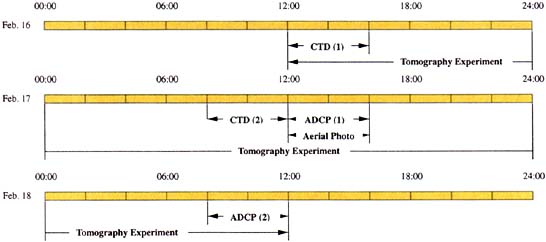
Figure 4 is the sketch of the moored velocity tomography system deployed in the sea. A GPS antenna, float, pressure housing, transmitter, hydrophone and weight are in a line. The timetable of the experiment is listed in Table 2. In the tomography site, a tow-day running experiment will be carried out during Feb. 16-18, 1999. Two-times CTD, two-times ADCP and aerial photos will aiso be planned in comparison with the tomography.
In first day, the tomography experiment starts at noon. The first CTD cast is done in the afternoon. In second day, the second CTD and first ADCP are prepared in the morning and afternoon, respectively.The aerial photo is also tried in the afternoon. In the morning of the finally day, the second ADCP is done, and the tomography experiment ends at noon.
CTD casts are performed at sixteen stations marked in the Fig. 5. The shipboard ADCP is done along the observation lines shown in the Fig. 6.
The tidal vortex pair generated in the tomography site near the phase of flood tide is well pictured in Fig. 7. The result of compute simulation in a model ocean shows that this tidal vortex pair can bemeasured by the velocity tomography experiment with five stations.
Ѓ@
REFERENCES
Ѓ@
[1]Ѓ@Zheng, H., N. Gohda, H. Noguchi, T. Ito, H. Yamaoka, T. Tamura, Y. Takasugi and A. Kaneko: "Reciprocal sound transmission experiment for current measurement in the Seto Inland Sea, Japan", J. Oceanogr., 53. 117-127, 1997.
[2]Ѓ@Zheng, H., H. Yamaoka, N. Gohda, H. Noguchi and A. Kaneko: "Design of the acoustic tomography system for velocity measurement with an application to the coastal sea", J. Acoust. Soc. Japan(E), 19, 199-210, 1998