The results from one of these lines will be compared with propagation models to demonstrate some of the effects of undersea topographical interference.
Comparison of arrival waveform
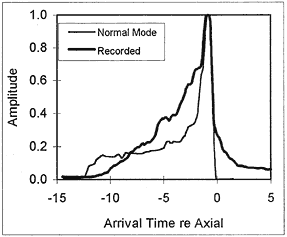
Figure 2 compares the shape and duration of the signal recorded at Ascension with the Fourier synthesis of a normal mode model.The normal modes were calculated using the Kraken method (3) for a range-invariant sea with a floor depth of 3500 metres, Neglecting the obvious differences in the shape of the up-slope, the time duration is approximately the same. The shape of the peaks is well matched for about 1.5 seconds.

Figure 2. Comparison of envelopes of recorded and normal mode synthesised signals.
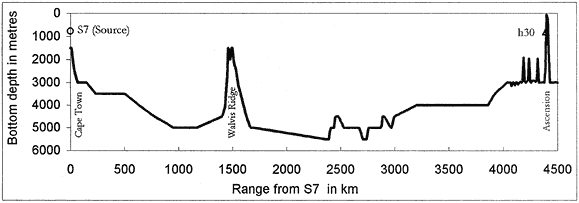
Figure 3 shows the entire path in profile. The bathymetry used for these plots is derived from the GEBCO Digital Atlas CD-ROM. (4) The contour interval of these charts for deep water is usually 500 or 1000 metres and the distance between abjacent points on contour lines can be as close as 1500 metres. The distance between the source and the receiver is 4.39 Mm.

Figure 3. Bathymetry of the Cape Town to Ascension path for S7 to h30
In Figure 3, Walvis Ridge can be seen to rise to within some 1700 metres of the surface. One would expect that some of the deeper rays would be intercepted by the ridge, thus causing the recorded arrival waveform to be shorter than that shown in Figure 2.
Predicted delay time for refracted rays passing over Walvis ridge
The sound speed profile at Ascension was chosen as being representative of the area. For simplicity an invariant sound speed profile was used for these simulations. The deviations in the actual sound speed profile would seem to be unimportant in comparison with the effects being considered here. The new Munk equation (Equation 1) was used to fit the sound speed profile.
BACK CONTENTS NEXT