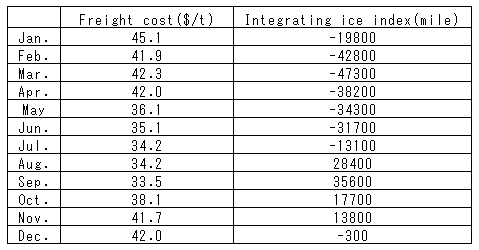
Based on the results above, the relation between the freight cost and ice index in the NSR is investigated. Table 4.1.10 shows the freight cost of 40BC by month in 1964 as an example and the cumulative ice index which means the sum of a multiplier of the segment distance by an ice index of the segment along the N-route from Yokohama to Hamburg.
Table 4.1.10 Integrating ice index and the freight cost (1964)
The ice index represents the quantitative difficulty of navigation. The freight cost decreases with increasing the ice index. The freight costs and the cumulative ice index in each month for 10 years from 1980 to 1989 were calculated to reveal the relation between those, as shown in Figure 4.1.19. Figure 4.1.20 shows that of 50BC during the same term.
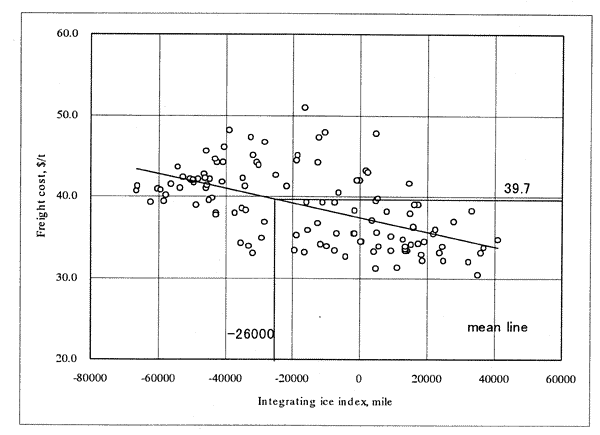
Figure 4.1.19 Integrating ice index v.s. freight cost of 40BC
前ページ 目次へ 次ページ