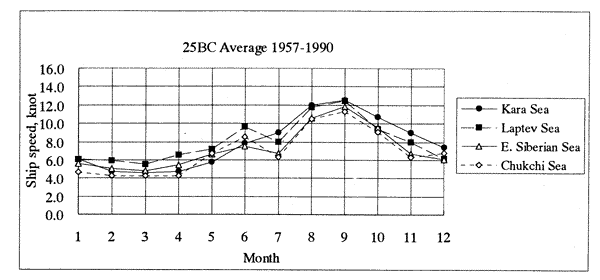

Figure 4.1.13 Navigation speed for the 25BC by the sea area, as an average of 1957-1990

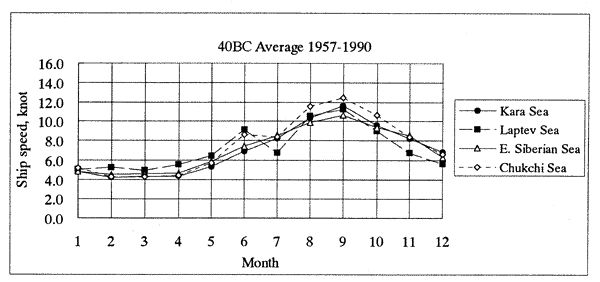
Figure 4.1.14 Navigation speed for the 40BC by the sea area, as an average of 1957-1990

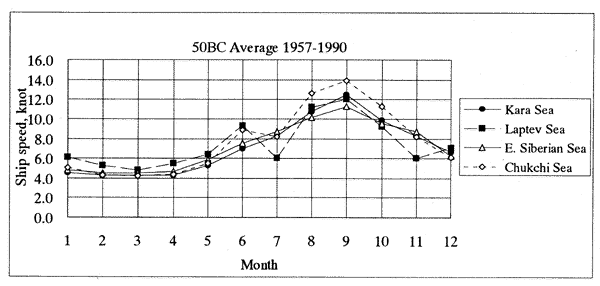
Figure 4.1.15 Navigation speed for the 50BC by the sea area, as an average of 1957-1990
前ページ 目次へ 次ページ
|

|