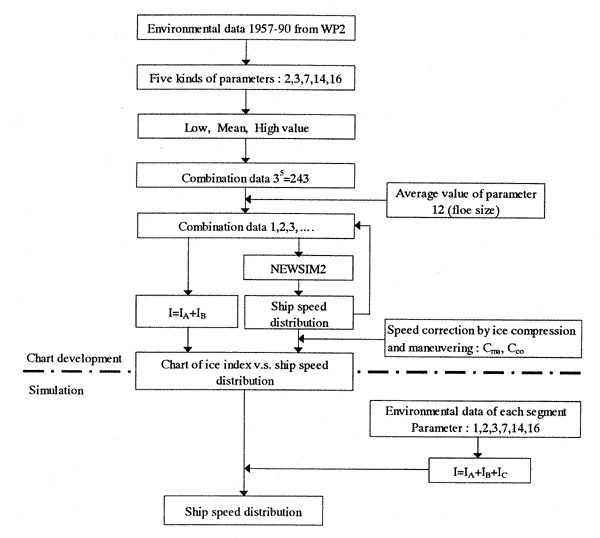
2.6.3 Ice index v.s. ship speed
The flow to develop the chart for ice index v.s. ship speed
To develop an ice index v.s. ship speed chart, the environmental data supplied by WP2 and the ship speed code NEWSIM2 are used. The flow is shown in Figure 2.6.7.
Figure 2.6.7 Flow of developing the chart For ice index v.s. ship speed
Combination data
lf all environmental data supplied by WP2 are used, it will take enormous amount of time to develop charts. Therefore, the mean first-year ice concentration(para.2), the mean multi-year ice concentration(para.3), the mean ice thickness(para.7), the mean ridge size(para.14), and the mean ridge density(para.16) that are construction components of IA and IB covering most part of ice index, were selected as representative parameters.