[1997]. Mean fields of temperature and salinity are provided on a 50 km grid over the Arctic Ocean and come from various hydrographic measurements collected during the years 1950-1989 over the winter season (Dec-May). Results from the August-September 1991 Oden'91 icebreaker drift have been described in a number of publications [e.g., Anderson et al., 1994].
Results from the August-September 1993 submarine cruise SCICEX'93 are described in Morison et al.[1998].
丂
SCICEX'95 was conducted in April-May, 1995. Here we focus on temperature and salinity profiles obtained while the ship was underway using expendable XCTD's manufactured by Sippican. Calibration of XCTD data was accomplished by comparing with five 乬surface casts乭, made by bringing the submarine up through the sea ice and deploying a SeaBird SBE-19 CTD through the ice using a portable winch. Co倣bining the SBE-19 drift and XCTD sensor and depth errors results in estimated salinity errors that range from 0.03 at 50 m to 0.06 at 500 m. Potential temperature errors range from 0.03亷 at 50 m to 0.04亷 at 500 m. These uncertainties do not impact the analyses we present below which depend on T-S properties with precisions on the order of 0.1.
丂
3.SCICEX'95 DATA
丂
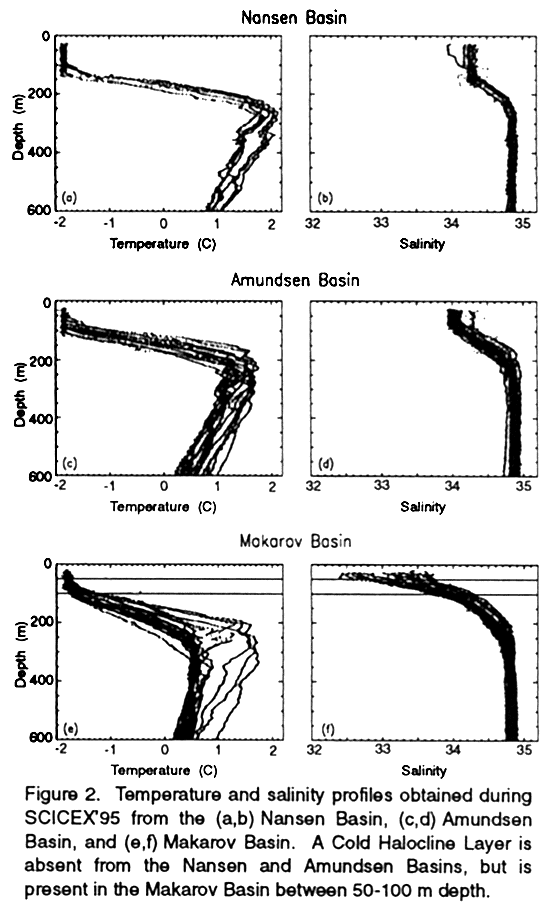
We first consider only the data from SCICEX'95. Figure 2 shows temperature and salinity profiles from the three basins of the eastern Arctic. The Nansen Basin (Figures 2a and 2b) includes data from over the Nansen-Gakkel Ridge.
丂
The Nansen and Amundsen Basins (Figures 2a-d)do not exhibit a CHL, i.e., temperature and salinity in the surface layer are uniform down to the same depth. This layer is quite deep in places: up to about 150 m over the Nansen-Galkkel Ridge, where it is also the most saline surface layer in the data set, averaging about 34.25. It is shallower and fresher both north and south of the Nansen-Galkkel Ridge, although the data coverage to the south is limited. With regard to AW, core temperatures are highest in the Nansen Basin and slightly cooler in the Amundsen Basin.
丂
The Makarov Basin data (Figures 2e and 4f) show a much cooler AW and a definite CHL in the 50 m-100 m depth range. A transition region exists in the Makarov Basin (Figures 4e and 4f) within about 100 km of the Lomonosov Ridge, where the deep AW is as warm as the Amundsen Basin but the surface waters are fresh like the rest of the Makarov Basin.
丂
An important point for our purposes is that, using data collected up through the summer of 1991, Rudders et al [1996] found a riverine influence in the Amundsen Basin.
That is, they noted the presence of relatively fresh surface waters and a CHL in the Amundsen Basin. A comparison with our Figures 2c,d shows that conditions had changed significantly by the time of SCICEX'95. This change is explored further in the next section.
4. SPATIAL/TEMPORAL CHANGES
丂
Here we examine the spatial variations of the mean salinity over the depth interval 40-60m. This represents the winter mixed layer saliently in much of the data (particularly the Eurasian Basin). We use this depth interval in order to compare between SCICEX'95 (a winter cruise) and SCICEX'93 and Oden'91 (which contain a shallow summer melt layer). We also use this salinity as a tracer for the presence or absence of a CHL. Where it is high and 34-34.25, the winter mixed layer