
|
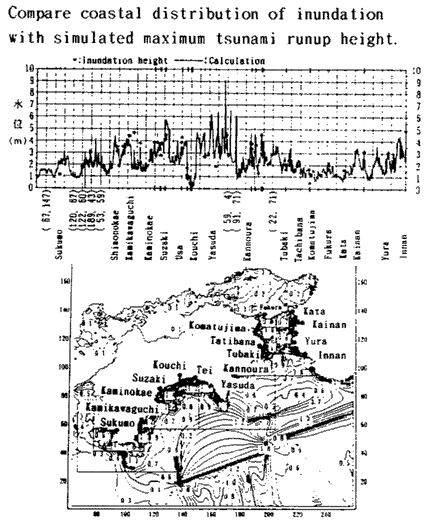
Fig- 6
Distribution of maximum tsunami runup height by simulation for Showa-Nankaido Earthquake tsunami in coastal area of Nankaido
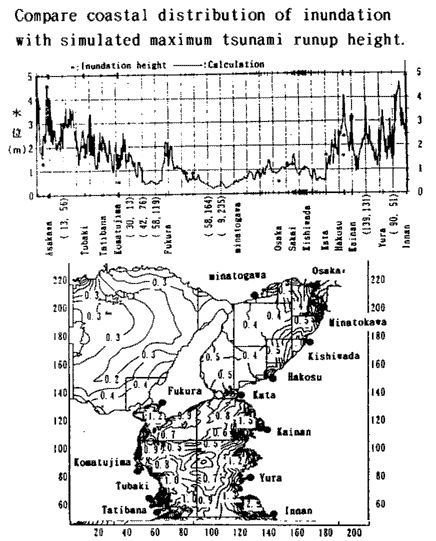
図−7
Distribution of maximum tsunami runup height simulation for Showa-Nankaido Earthquake tsunami in Osaka-bay to Kii-Suido area
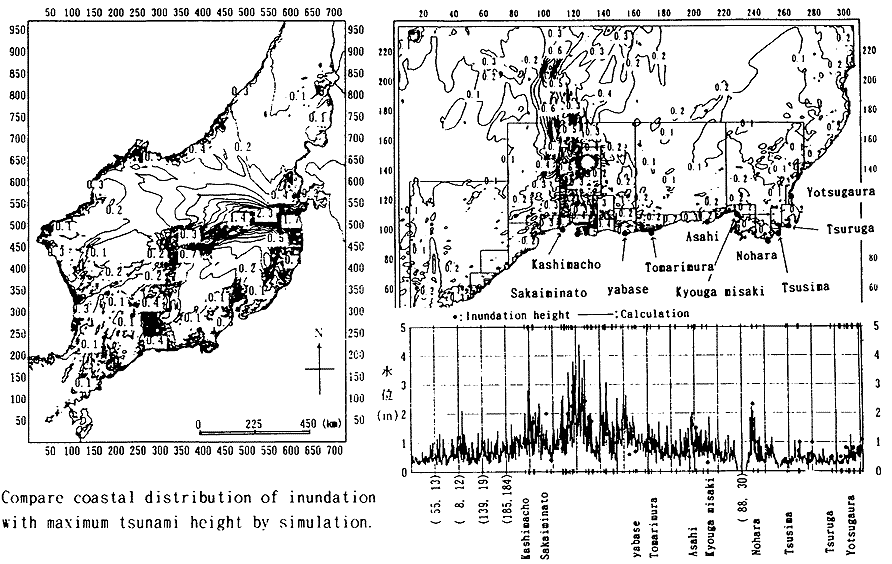
図−8
Distribution of maximum tsunami runup height by simulation for Nihonkai-Chubu Earthquake tsunami in Japan-Sea and the Sanin coastal area
前ページ 目次へ 次ページ
|
|