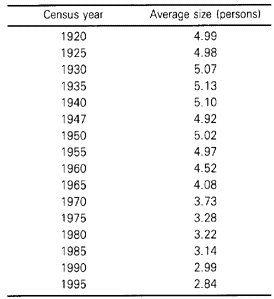
Table 9. Trend in the Average Household Size for Japan: 1920-1995

Source: Statistics Bureau, Management and Coordination Agency, Popularion Censuses.
Note: Detinitional changes have been introduced to the concept ot "household"
since the 1970 census.
1935, the size of household increased appreciably and this phenomenon is principally
attributable to a reflection of mortality improvement. In Singapore, by the same token,
between 1957 and 1970, the household size increased sizably from 4.8 to 5.4 and this
enlargement may at least partly be explained by mortality reduction.
Nevertheless, when demographic evolution proceeds, effects of fertility decline have
been captured sooner or later in the household size and structure when the mortality
decline has lost its momentum and the rise of life expectancy has hit the plateau. The
diminution of household size has started out and then it precipitates. The average size of
households for Japan is now 2.84 and will soon become 2.6 by 2010 according to the
projections (Institute of Population Problems, 1995).
According to a multiple regression analysis performed by the United Nations Population
Division some years age (United Nations, 1969), the shrinkage of household size was mainly
attributable to the reduction of fertility. This relationships may still be holding at
present. However, the increasingly significant process of nuclearization or nucleation of
the fa-
BACK CONTENTS NEXT