|
1. Nanotechnology R&D Investment
Nanotechnology R&D spending is distributed among governments (including national, regional, State, and local), universities, corporations, and venture capital investors. The availability and consistency of accurate figures varies for the different categories. When comparing the data available for various countries, difficulties may arise due to differences in the definition of nanotechnology, the inclusion of private contributions or other variations in the calculation of government funding, difficulty in getting some private―especially venture capital―investment data, mismatch in investment periods, and the various exchange rates employed. Rather than attempt to normalize disparate data sets, the NNAP has chosen to review a sampling of available data and to identify common trends.
1A. International Government Spending
White sources vary regarding international levels of nanotechnology R&D investment, one thing that all the data sets agree upon is that nanotechnology spending has been steadily increasing, reaching record levels in 2005. For the purpose of illustration, Table 1 and Figure 1 show one set of estimates indicating that national investments in nanotechnology worldwide increased over eightfold during the period from 1997 to 2005. Investment estimates shown in Table 1 are made using the nanotechnology definition of the NNI (this definition does not include microelectromechanical systems [MEMS], microelectronics, or general research on materials).
Other estimates vary from the amounts shown in Table 1. A report by the European Commission (EC) (2004) estimates that total worldwide government spending in 2003 was just over $3.5 billion, including funding by U.S. States (in addition to Federal programs) and by original European Union (EU) members and associated and acceding European countries.
In a more recent report, Lux Research (2004) estimated that worldwide government spending on nanotechnology research reached $4.6 billion in 2004: approximately 35% ($1.6 billion) was by governments in North America; another 35% ($1.6 billion) was by Asian governments; 28% ($1.3 billion) was by European governments, including the EC; and 30% ($133 million) was by all other governments. The Lux Research data include U.S. State funding in the total for North America and incorporate figures from associated and acceding EU countries in the European estimate.
As previously stated, available figures do not always allow for an "apples to apples" comparison, even among Federal Government expenditures. For instance, some countries invest in research through a combination of Government and corporate contributions. There is often inconsistency in the definition of nanotechnology for purposes of counting R&D expenditures. For example, some countries may include MEMS or biotechnology funding that is not counted under the strict U.S. definition of nanotechnology. Another variable between countries is the treatment of salaries for researchers. Whereas, U.S. figures include a salary component (e.g., as a portion of research grants and for Federal laboratory employees), many other countries fund salaries out of separate accounts from those reported as "nanotechnology R&D."
Although direct comparisons are difficult, the data collectively show that many countries are making significant public investments in nanotechnology R&D, and that these investments have increased sharply since 2000. The similar levels in the investments by the United States, Europe, and Japan, as shown in Figure 1, suggest an element of competition among these leaders. Because the NNAP members believe it is important for the United States to understand how its Federal investments stack up against public investment by other countries, the Panel has commissioned the Science and Technology Policy Institute (STPI), a Federally Funded Research and Development Center (FFRDC) that provides technical research and analysis to the Federal Government, to do a more detailed study to assess U.S. funding as it compares to other governments, including developing a means for normalizing and comparing international government investments.
1B. Regional, State and Local Spending
One difficulty in comparing U.S. Government spending to foreign government spending is that the contributions of U.S. State and local governments (and their foreign counterparts, where they exist) are often overlooked. A fair assessment of the overall U.S. competitive position must therefore include the significant contributions of U.S. State and local governments.
Regional, State, and local initiatives provide a vehicle for additional R&D funding, and a vital avenue for commercialization and economic development activity. In fact, State and local governments typically develop initiatives and commit funding precisely for the expected local economic development benefits this investment will yield. Lux Research reports that in 2004 U.S. State and local governments invested more than $400 million into nanotechnology research, facilities, and business incubation programs (Lux Research, Inc. 2005). Funding provided by State governments is often augmented, or leveraged, by additional resources provided through partnership with local private sector interests, universities, Federal Government agencies, and/or other interested regional organizations. These partnerships typically seek to build on existing regional competencies (e.g., a local research institution, a Government laboratory, and/or a strong local high-technology business community). A partial list of State investments in R&D infrastructure, typically at universities, is shown in Table 2.
In addition to supporting university-based infrastructure, many regional, State, and local initiatives support the development of a technically skilled workforce through the creation or promotion of education and training opportunities. Some have done this by leveraging existing Federal programs (e.g., NSF's Nanotechnology Undergraduate Education and Research Experience for Undergraduates programs) or through the establishment of new programs, such as providing nanotechnology-relevant curriculum assistance to community colleges. Another function of many regional initiatives is to facilitate partner access to NNI user facilities as well as to other nanotechnology resources and business expertise.
|
Table 2.
|
Nanotechnology R&D Infrastructure Investments at State Level
|
| State |
Recipient |
Description |
Partnership Model |
| AZ |
Nano-bio research center |
Research
Infrastructure |
University-State |
| CA |
California Nanosystems Institute |
Building
Infrastructure |
Metropolitan-State |
| FL |
Center at University of South Florida |
Faculty Recruitment & Infrastructure |
University-State |
| GA |
Center at Georgia Tech. |
Building & Research
Infrastructure |
|
| IL |
Nanoscience Centers
(Northeastern Univ., U. of IL, Argonne National Laboratory) |
Building & Research
Infrastructure |
Non-profit-Metropolitan-Regional |
| IN |
Nanotechnology Center at Purdue |
Building
Infrastructure |
|
| NJ |
Support at NJ Institute of Tech. and photonics consortium |
Building
Infrastructure |
State-Industry |
| NY |
Nanoelectronics Center, Albany |
Building & Research Infrastructure |
University-State |
| OK |
NanoNet |
EPSCoR |
University-Region |
| OR |
ONAMI-Oregon Nano-Micro
Interface Institute |
Research
Infrastructure |
University-Industry |
| PA |
Nanotechnology Center |
|
Non-profit-University-State |
| SC |
NanoCenter |
Building
Infrastructure |
|
| SD |
Center for Accelerated
Applications at the Nanoscale |
Research
Infrastructure |
University-State |
| VA |
Various institutions and Luna Innovations |
Research Matching & Infrastructure |
University-State |
| WA |
University of Washington, Washington Tech. Center |
Clean Room
Maintenance |
University-State
Partnership |
|
|
Source; NSTC Report of the NNI Workshop on Regional, State and Local Initiatives in Nanotechnology, September 30-October1, 2003 (2005). Note: The examples offered here provide a sampling of infrastructure investments by various U.S. States. This list is not comprehensive and does not include non-infrastructure investments.
|
Defining the Nanotechnology "Industry"
Attempts to define the nanotechnology "industry" inevitably result in definitions that are either too narrow or too broad.
If the definition were limited to that part of industry in which the nanotechnology aspect is dominant―that is, to companies that deliver pure nanotechnology―then it would only capture highly specialized activities such as the manufacture and sale of carbon nanotubes. Under this narrow definition the industry appears extremely small, and is likely to remain so for some time. The definition could be broadened somewhat by including the manufacture and sale of instruments that are necessary for measuring and manipulating matter at the nanoscale, because these sales are nanotechnology dependent. Even this expanded definition, however, continues to suggest a very small industry.
Taking a broader economic view, it is noteworthy that a wide variety of industries―including electronics, cosmetics, textiles, and pharmaceuticals―already use nanotechnology to make existing products better. Nanotechnology is used to produce stain-free khakis, transparent zinc-oxide-based sunblock, scratch-resistant automobile paint, more powerful semiconductors, and many other products. Under this further expanded 'count-any-contribution' definition, the nanotechnology industry is already quite large, and likely to grow to an enormous scale. Because nanotechnology does not dominate these products, however, this definition arguably over-counts the actual contribution of nanotechnology to the economy. Nonetheless, nanotechnology does contribute to the performance of these products and, in many cases, makes the performance possible in the first place.
Ultimately, nanotechnology is expected to be embedded throughout our economy, its contributions ranging from barely detectable to wholly dominant. Any credible attempt to define a nanotechnology "industry," therefore, will have to establish a threshold contribution level and explain why that level was chosen. This report does not attempt to choose or defend such a threshold.
While much activity is taking place to organize and secure support for regional nanotechnology initiatives from State and local governments and the private sector, the ultimate economic development success of most of these ventures remains to be seen. To the extent that nanotechnology parallels the biotechnology industry, regional "cluster" development may prove an excellent model for equipping local communities with competitive advantages. Technology-based cluster development builds upon a foundation of critical components for economic success―research expertise and infrastructure, technical and management talent, risk capital, commercial infrastructure, and an entrepreneurial culture. Certainly, this type of activity should be encouraged and its progress monitored to determine which of the arrangements ultimately yield long-term economic development and growth.
A workshop held in the Fall of 2003 brought together representatives from regional, State, and local nanotechnology initiatives across the country to share information and experiences. The resulting report (NSTC 2005), to be released soon, will serve as a useful primer for those who are at the early stages of launching similar activities. The NNAP strongly encourages the NNI to continue to interact with those regional, State, and local initiatives to assist their progress and to seek additional channels by which technology transfer may take place.
Nanomaterials for Clean Energy
Nanotechnology is helping to clean our air thorough better-preforming and cheaper catalysts. By controlling the size and composition of platinum-based catalytic materials, the number of active sites can be dramatically increased, leading to improved catalytic converters that reduce auto emissions and help control pollution from power plants or stationary industrial sources. In today's converters, much of the platinum, which makes up roughly two-thirds of the total cost of the converter, is buried inside relatively coarse metal particles where it is unable to react with pollutants.
Researchers at Stanford University (supported by NSF and DOE) and NASA Ames Research Center developed new concepts for computationally modeling nanomaterials. In 2003, Nanostellar, Inc. was formed to develop the concepts into technologies for designing and fabricating controlled nanomaterials with optimized properties for catalytic reactions. Nanostellar has dramatically reduced the amount of platinum required for automotive emission control by designing and producing nanoparticles that combine the precious metal with other less costly metals. In addition to lowering cost, converters based on nanocomposite catalysts outperform traditional products, particularly at "cold start" where most gasoline and diesel engine pollution is generated.
Nanotechnology's contributions to pollution control may just be beginning. In a separate study, researchers at Brookhaven National Laboratory have shown that platinum mixed with iridium in single atomic layers is more than 20 times more active on a per atom basis than commercial catalysts.
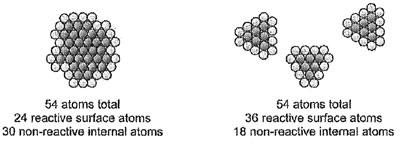
Why nanoparticles make better catalysts
In addition to finding use in pollution control devices, nanostructured catalysts can improve the efficiency and reduce the cost of conventional and next-generation technologies for energy production and storage (e.g., in fuel cells, coal gasification, and improved photovoltaic cells).
1C. Private Investment
Measures of private investment include both corporate internal investment and venture capital activity. Obtaining firm data in this area is difficult, because private corporations and investors often consider such information to be proprietary. However, in 2003 the European Commission estimated worldwide private R&D funding to be close to 2 billion Euros (Commission of the European Communities 2004).
Of the $8.6 billion that Lux Research estimates was spent on nanotechnology R&D worldwide in 2004, $3.8 billion was by corporations: 46% ($1.7 billion) was by North American companies, predominantly in the United States; 36% (1.4 billion) was by Asian companies; 17% ($650 million) by European firms; and less than 1% ($40 million) was by businesses in other regions. Additional private sector investments were made by venture capital firms investing in nanotechnology start-up companies. These investments totaled roughly $400 million in 2004 (Lux Research Inc. 2004).
|
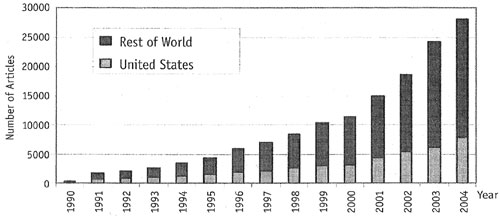
Figure 2.
|
Number of Articles in ISI Web of Science Database Found by Searching "nano*"
|
|
Source: J. Murday, U.S. Naval Research Laboratory
|
Because nanotechnology is a relatively new area, the "industry" is evolving rapidly. A study by EmTech Research (2005) identified approximately 600 companies based in the United States or with significant U.S. operations that are engaged in nanotechnology R&D, manufacture, sale, and use. Of these nearly three-quarters (72.9%) were founded in the past 10 years. A significant percentage of those companies (57.6%) have products on the market, although business plans based on development and licensing of intellectual property are widespread. Large companies typically are focusing more on applications and many have early stage R&D subsidiaries and/or research collaborations with small businesses or start-ups. Members of the NNAP observe a similarity between nanotechnology and the biotechnology industry in the 1980s and 1990s, suggesting that future acquisitions and consolidations are likely.
|