|
5. SIMULATION AND COMPARISON
The ship maneouvring motion is simulated on PC. Part results are illustrated in Fig.5-13. The collection of sea trial data is presented thereafter in Table 2-4, where braking capability is compared between the simulation results and the sea trial data in Table 4. All the sea trials were conducted in August 1995 at Cockburn Sound under the condition of wind force 0 knots, sea and swell 0 m as well [2].
5.1 Simulation Results
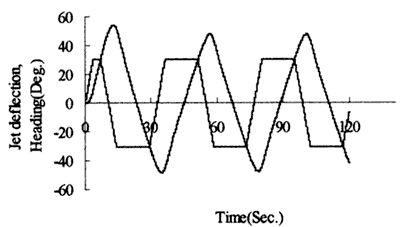
Fig.5 30° zig-zag test (engine 1940 RPM).
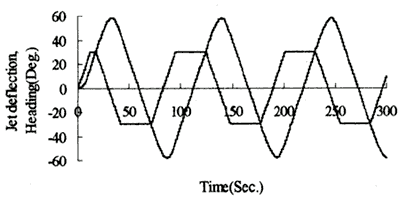
Fig.6 30° zig-zag test (engine 1000 RPM).
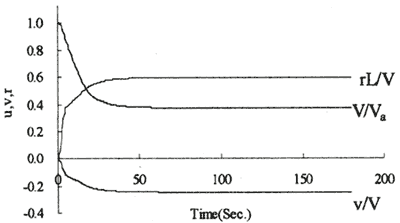
Fig.7 |
Change of u, v, r at 30° turning (v, r reversed sign for the purpose of nice display). |
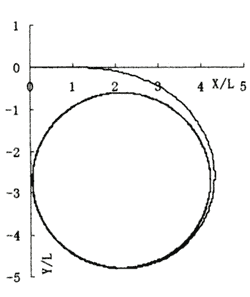
Fig.8 30° turning (engine 1940 RPM).
Fig.9 30° turning (engine 1000 RPM).
|