|
4.2.2 Skill Improvement with the Change of ES Value
ES value becomes larger when a navigation water area is restricted and traffic is congested. If a mariner performs sufficient collision avoidance manoeuvres well, the ES value decreases.
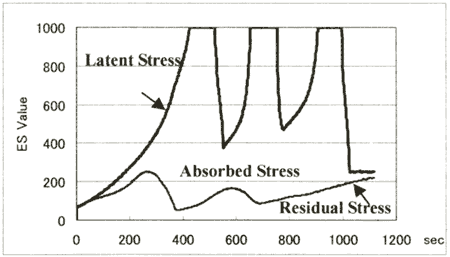
Fig. 4 shows the ES value output for own ship underway as a pattern diagram, Under the designed operational and traffic environments in the scenario, the ES value calculated when navigating at a given speed and course without any action to avoid collision (shown as bold line) is defined as latent environmental stress, and the ES value calculated under the same scenario with the action taken in a timely and appropriate way (shown as thin line) is defined as residual environment stress.
The area between latent and residual environmental stress is considered to be the result of stress absorption by a mariner's collision avoidance manoeuvres.
Therefore, it is possible to evaluate skill improvement by judging the increase of stress absorption as the experiments proceed.
Fig.4 Illustration of output of ES value
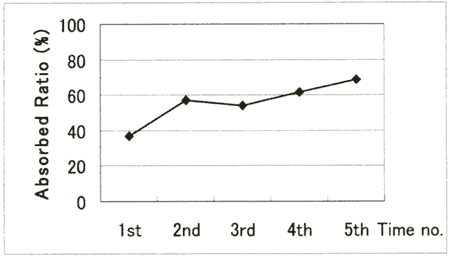
Fig. 5 shows how the amount of stress absorption changed as training proceeds. And it shows the total average for 60 trainings with the 4 students.
Fig.5 Overall absorbed ration of ES value
The vertical axis of the figure shows the ratio of stress absorption, which is calculated by the amount of integration of output ES value of residual environmental stress as numerator, and the amount of integration of latent environmental stress as denominator. It is clear that the ratio of stress absorption has an upward tendency as the number of times of training increases.
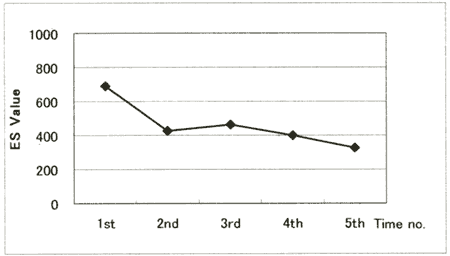
Fig. 6 shows the change of maximum ES value as the number of times of training increases. And it shows the total average for the 60 trainings with the 4 students. It is considered that the maximum ES value has a downward tendency as the number of times of training increases.
As can be seen from the analysis results, the results of experiments show a certain increasing trend for stress absorption, and a certain decreasing trend for maximum ES value. That is, it is considered that the results of the experiments express the skill improvement of the students in accordance with the meaning of each index.
4.2.3 Skill Improvement with Change of TTC
In education and training using SHS, it is important to judge whether ship handling by a trainee is safe, and development of an index that can determine safety improvement systematically is desired.
DCPA is a typical yardstick, but this evaluation factor judges only a spot for one ship after collision avoidance manoeuvres, and it is possible that some subjective factors will enter into the evaluation, especially when setting a limit for DCPA.
A mariner needs to handle own ship in the process of overall navigation considering the reduction of risk of collision with another ship or contact with land in collision avoidance manoeuvres. So, it is necessary to evaluate the achievement of safety in the ship handling process when evaluating the skill improvement of a collision avoidance maneuver.
Fig.6 Overall average maximum ES value
From such a viewpoint, TTC is introduced as an objective numerical index showing the potentiality of a risk of collision or stranding in each time section of navigation. Danger of collision or stranding can be judged with the value of TTC and it is dangerous when the value is close to zero.
So, dangerous ship handling can be confirmed if the TTC value approaches zero in the process of navigation. In the calculation of TTC, the value outputted was less than 600 seconds. A period of 600 seconds corresponds to a distance of about 2 miles at 12 knots.
Fig. 7 shows the latent risk, when the own ship sails at the predetermined course and speed without any collision avoidance manoeuvres. In fact, a mariner decreases this danger by performing collision avoidance manoeuvres suitably and in a timely way. Therefore, it enables the educational result of skill improvement to be evaluated by calculating how much this danger decreased as the number of trainings increased.
The solid lines in Fig.7 show the risk of collision with other ships and the dashed lines show the risk of stranding. The upper part of Fig. 7 is for scenario 1, the middle is for scenario 2 and the lower is for scenario 3. Here, skill improvement is judged with the reduction ratio of TTC, which is calculated by taking time integration by second for TTC in Fig. 7 as a standard value.
TTC was detected in only 3 cases of the experiment among 60 cases performed with the 4 students. In Fig. 8, the solid line shows risk of collision with other ships, and the dashed line shows risk of stranding.
From this figure, it is observed that the risk of a near miss with other ships or approaching close to shore during a collision avoidance action is detected by objective numerical information through the TTC.
|