|
5.2 Assessment parameter and criteria
One specific problem of evaluation of trainee performances with respect to collision avoidance training is the lack of clear evaluation criteria. In [3] Hilgert and Baldauf have already investigated this problem regarding the need for "on board" assessment of encounter situations and taking into consideration the aspect of collision risk.
In [3] the development of a COLREG based model is described which consists of four risk levels. These are derived from the actions required by the relevant steering and sailing rules. For the "on board" use of the model variable limit values were defined. They can be calculated and compared with actual measurement values of CPA and the real distance between ships involved in the encounter situation. An overview of the model is given in Table 2.
Table 2 Risk model for situation assessment and evaluation of simulator runs
| risk level |
limit values and criteria |
Level 1
risk of collision is developing |
CPA < CA
and
RNG > RA |
level 2
risk of collision exists |
CPA < CA
and
RM < RNG ≤ RA |
Level 3
danger of collision is developing |
CPA < CA
and
RC ≤ RNG ≤ RM |
Level 4
danger of collisions exists |
CPA < CH
and
RNG < RC |
|
CA is the limit value for the minimum safe passing distance which must be compared with the actual CPA. Depending on the specific situation parameters CA varies between 0.25 nm and 1.5 nm RA, RM and RC are limit values for distance borders mainly dependent on the relative velocity of the approaching vessels and response time limits for necessary actions to comply with the rules.
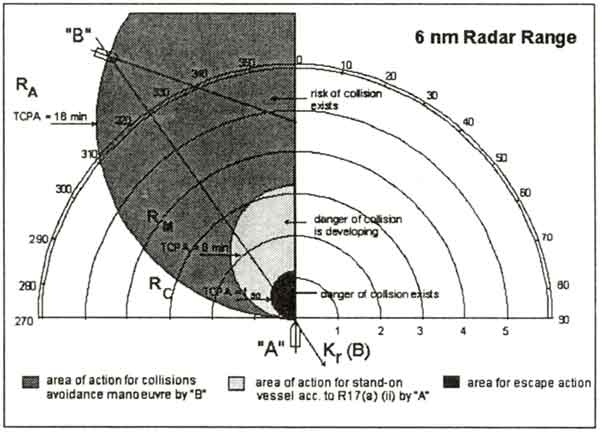
With respect to an encounter situation on crossing courses under conditions of good visibility the "assessment range" RA represents that distance from which the "stand on" vessel has to keep her speed and course. If the "give way" vessel has not taken appropriate action up to the "manoeuvring range" RM, so the "stand on" vessel may take action in accordance with rule 17 (a) (ii). The last limit value represents the "critical range" RC Which indicates that limit for the "stand on" vessel where she has to initiate her evasive manoeuvre according to rule 17 (b). Figure 8 illustrates the application of the model and the variable limit values for the assessment of the risk of collision.
Figure 8 |
Boundaries for actions of a stand on vessel "A" approaching to another give way vessel "B" on port side |
The model illustrated can be enhanced by the further levels of "no approaching"," encounter free of risk" and "collision unavoidable" However, these are not yet relevant for evaluation purposes.
The following example of ARPA with the integrated evaluation tool investigates the assessment parameters CPA, TCPA and distance to other objects. The implementation of further risk parameters into the evaluation tool is planned in near future.
5.3 Evaluation and assessment by software tool
Figure 6 shows an extract of relevant data at the 28th minute of exercise run. The trainee's vessel AIDA coming from W-Hinder and faced to a existing ARPA situation with two crossing vessels (deep draught vessel LAGENA and tanker PATRIOT) which reduces her speed to slow ahead in order to let the deep draught vessel pass at a safe distance ahead. Selected CPA 1.5 nm, also the criteria of distance to other vessels was limited to 1.5 nm. Although at present situation (1710 sec) the CPA value within the criteria limit (1.6 nm, shown in the graphic window), the tool measured some violations during the exercise run (centred window left side). In relation to the selected parameter and criteria (bottom window), all activated data are measured and time indicated violations and duration to objects are presented. During the exercise the CPA to object 13 (LAGENA) and 19 (PATRIOT) falls slightly short of 1.5 nm twice for duration of 6 respectively 10 minutes. In shifting the slider to the right also the numeric values of differences to CPA (1.5 nm) would become visible. Violation to object 9 (CV ROSTOCK) at the beginning of exercise was compensated by course change of traffic vessel to starboard, recorded in graphics.
In the data analysis modus (see Figure 7) the graphics show the progress in the distance to all vessels. The vertical dotted line indicates the actual time according to the slider position. All violations by crossing the criteria line below 1.5 nm are listed in the left centred window with indication of time, object and duration.
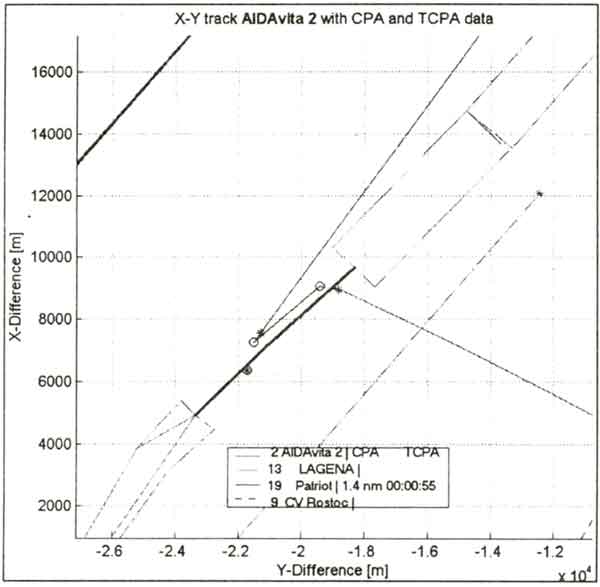
Figure 9 ARPA exercise English Channel - critical situation with tanker Patriot
X-Y track AIDAvita 2 with CPA and TCPA data
Figure 9 shows the detailed situation shortly before crossing the TSS separation. Here the CPA to a tanker vessel is smaller than the criteria allows for. The trainee's vessel joining the TSS in south westerly direction should alternatively have kept her course for the time being until CPA would have been increased to 1.5 nm. Due to direct course change to port the trainee also didn't meet the other criteria, that is, distance to other objects as recorded in Figure 7.
|