|
4 EVALUATION TOOL AND EXAMPLES FOR EVALUATION OF ELEMENTARY MANOEUVRES
4.1 Design of the evaluation tool
The evaluation tool consists of two different elements, the data analysis and the data evaluation and assessment surface.
The data analysis tool (Figure 3) which allows for a comprehensive analysis of all aspects of the simulated manoeuvre:
In the upper graphic the complete track history of a simulation run is shown. Together with the ship steered by a trainee a number of traffic ships can be seen. Additionally relevant data from a sea chart are shown as well. A slider on the right hand side of the graphic allows for the timely and detailed analysis of periods during the simulation. The track can be presented in x/y co-ordinates or in geographical co-ordinates.
The lower graphic displays a number of ships data measured during the simulation. This includes Rudder angle, speed or course information of all ships. All graphics can be zoomed so that details of the exercise become visible and the graphical data shown on the surface can be saved and exported for further use.
Figure 3 |
Segments of the analysis tool surface -sections track and measurement data |
X-Y track of bridge 3 and traffic ships
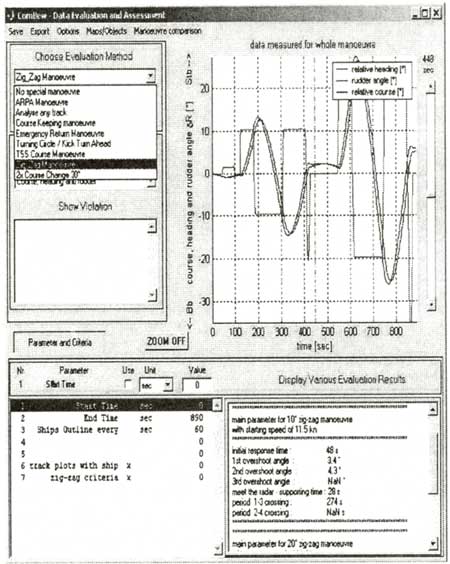
The concept of data evaluation and assessment tool (Figure 4 and Figure 5) is to provide a specific tool to evaluate a variety of different manoeuvres with one common interface. In the upper left window of the surface (Figure 4) the type of manoeuvre to be evaluated can be selected from a number of manoeuvres provided using a popup menu. Once the type of exercise was selected, the table in the lower part of the figure shows all parameter and criteria for selection by choice. If none of the manoeuvres is appropriate, the parameter and criteria to be evaluated can be chosen individually as a default standard. The window can be scrolled until the desired parameter is visible (see Figure 6). For the time- and way- depended and other parameters the physical unit, type of criteria (minimum, maximum) and the criteria values can be specified. Parameters for calculation can be activated in the field "Use".
Figure 4 |
Evaluation tool - segments manoeuvre choice - example Zig-Zag Test 10°and 20° |
During the evaluation all measurement data are analysed automatically according to selected criteria. Time- and limit- dependant violations are shown in the central window (Figure 6) as well as penalty points according to an exercise specific algorithm.
Depending on the chosen manoeuvre several special evaluation algorithms are used to produce the results for the manoeuvre. The results of the particular evaluation are shown in the lower right table (Figure 4). Additionally different graphical presentations are provided which can be selected using another popup menu (Figure 4).
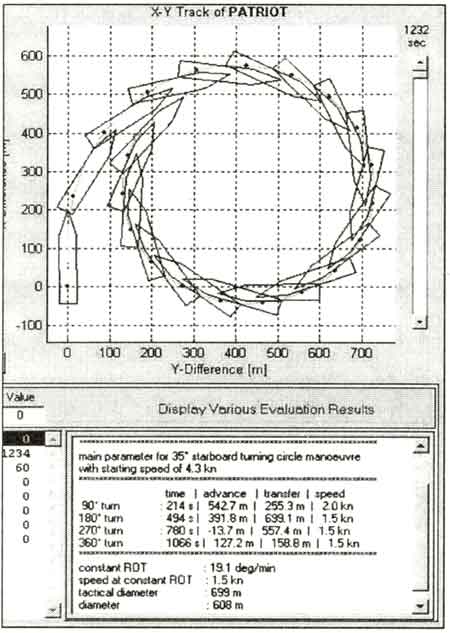
Figure 5 |
Evaluation tool - segments graphic and evaluation results - example turning circle |
4.2 Evaluation of elementary manoeuvres
Elementary manoeuvres are essential for the understanding of ship dynamics. Mayor elementary manoeuvres can be analysed by the evaluation tool. Although the object of evaluation can be seen more in correlation with ship specifics and is restricted in evaluation of trainee's performance, the accurate run down of those exercises supply trainees with a comprehensive understanding of ship dynamics.
As examples the Zig-Zag Test and Turning Circle are presented in Figure 4 and Figure 5. Both manoeuvres are indications for steering ability. In Figure 4 the graphic shows the relative heading and relative course as well as the rudder angle for the 10°Zig-Zag Test followed by a 20°manoeuvre. The resulting numerical values are listed in the lower window for the 10°Test (same criteria for 20°visible by scrolling), e.g. initial response time (before rudder to port or starboard), 1st and 2nd overshoot angle, supporting time of meeting the rudder and time of sequence or period from 1st rudder change until crossing original course after 3rd rudder change. In Figure 5 the main data for the completed circle track in sequence of 90°steps, e.g. time, advance track, transfer and speed are listed. In addition the values for constant rate of turn (ROT), speed at constant ROT, tactical diameter and diameter were automatically calculated by the tool.
An algorithm for evaluation of the Zig-Zag Test was developed with reference to the accuracy of the manoeuvre performance carried out by the students.
The quality of the students is measured by the ability to carry out the manoeuvre with regard to the initial phase (Ψ constant) and three rudder changes (Δδ1-Δδ3 ) including measuring the overshoot angles (with reference ROT) and time dependant accuracy a certain number of points can be collected. From the maximum value of points a certain number of points for each violation are deducted and after exceeding the limit of criteria penalty points are determined.
|