|
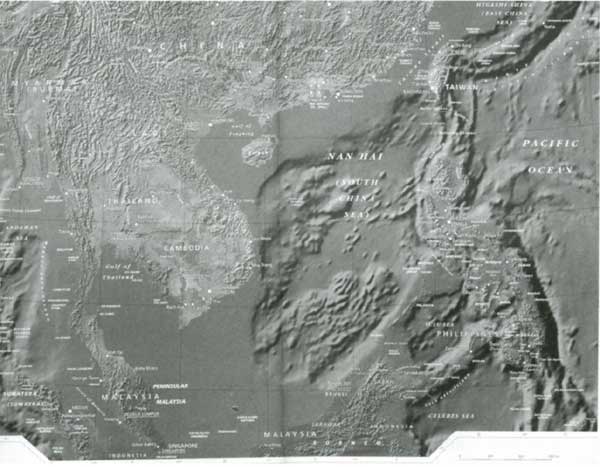
Figure 1. Satellite Map of the China Sea
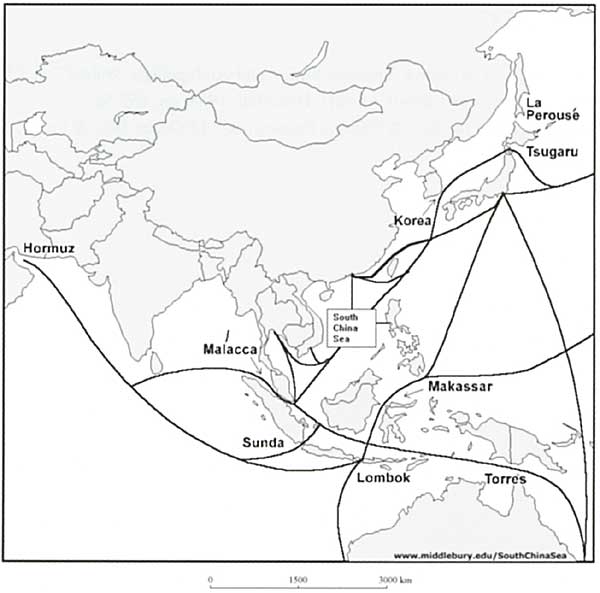
Figure 2. Major Asia-Pacific Shipping Lanes
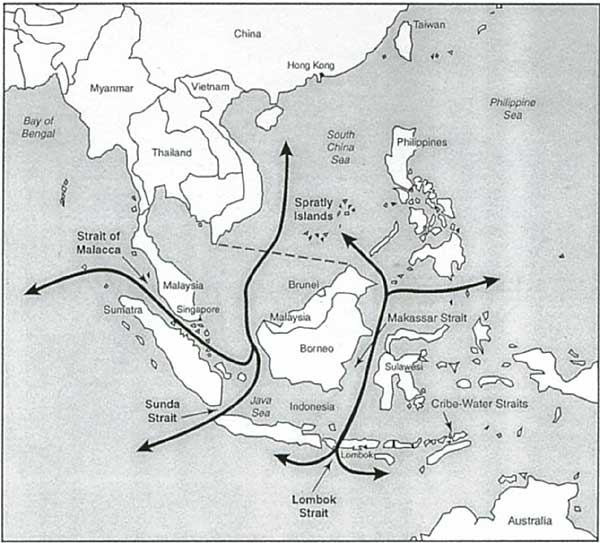
Figure 3. Chokepoints: Malacca Strait, Lombok Strait and Makassar Strait
| SOURCE: John H. Noer, Chokepaints: Maritime Economic Concerns in Southeast Asia, National Defense University. Washington, D.C. |
Figure 4. Volume of Trade in Southeast Asian Sea-Lanes (1993)
MARITIME EXPORTSa
| Economy |
Tons b
(millions) |
Value
($ billions) |
Percentage of Export Value |
| Japan |
33.6 |
153 |
42.4 |
| NIEs c |
24.7 |
78 |
25.7 |
| Australia |
133.6 |
17 |
39.5 |
| China |
8.9 |
20 |
21.8 |
| Europe d |
40.8 |
107 |
6.8 |
| Southeast Asia |
171.2 |
114 |
55.4 |
| United States |
11.1 |
15 |
3.3 |
| World |
830.0 |
568 |
15.1 |
|
MARITIME IMPORTSa
| Economy |
Tons b
(millions) |
Value
($ billions) |
Percentage of Import Value |
| Japan |
385.0 |
102 |
42.0 |
| NIEs c |
199.8 |
85 |
28.3 |
| Australia |
10.2 |
24 |
52.8 |
| China |
23.0 |
11 |
10.3 |
| Europe d |
41.7 |
162 |
10.5 |
| Southeast Asia |
139.4 |
118 |
52.5 |
| United States |
9.5 |
27 |
4.5 |
| World |
830.0 |
568 |
15.2 |
|
Source: Noer, Chokepoints: Maritime Economic Concerns in Southeast Asia, 1996.
Figure 5.1. World Crude Oil Flows 1997
World Crude Oil Flows 1997
34.8 Million Barrels Per Day
| Energy Information Administration |
Figure 5.2. Oil Traffic Supertanker Movement
a International cargoes that passed through the Straits of Malacea, Sunda, or Lombok, or by the Spratly Islands.
b All tons are metric tons, also called "long tons."
c Newly Industrialized Economies: Korea, Taiwan, Hongkong.
d Excludes eastern Europe and Mediterranean regions.
|