|
TOPEX/Poseidon and geostrophic current vector
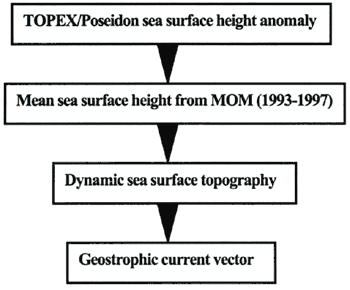
TOPEX/Poseidon launched in 1992 is a follow-on altimeter of Geosat and carries two altimeters shown in Table 2. With its sea level measurement accuracy of 4.2cm TOPEX/Poseidon data have been utilized for investigating various phenomena (Menkes et al., 1995; Polito and Comillon, 1997). In general, the collinear method is used in order to calculate the dynamic sea surface height from the satellite altimeter data (Kuragano and Shibata, 1997; Jacobs et al., 1999). In this study, the dynamic sea surface height is derived from the sum of the mean sea surface height from the model (GFDL MOM) (Hirose, 1999) and the temporal anomaly from the mean sea surface height from the altimeter. Figures 6 and 7 show the sea surface topography analysis procedure and the comparison of various sea surface heights along the orbit. Precise corrections for the altimeter data such as tidal and atmospheric corrections are referred to the TOPEX/Poseidon user handbook (JPL, 1997).
| (Enlarge: 26KB) |
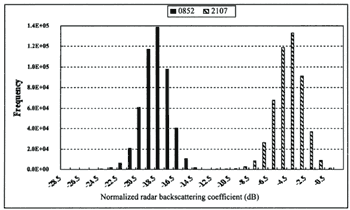 |
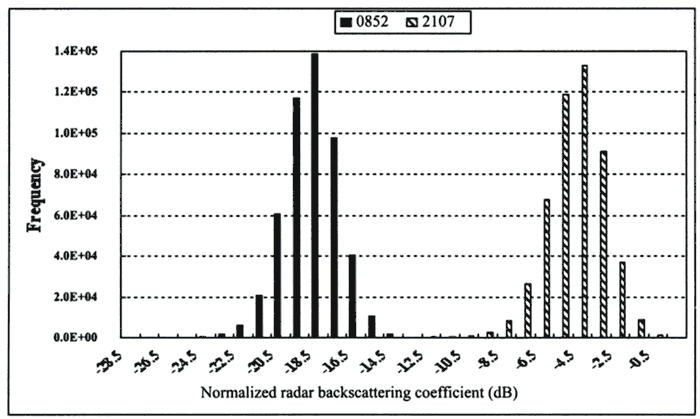
Figure 4. Histogram of Figure 3(a) (January 11,08h 52m (UT)) and (b)
(January11,21h 07m (UT))
| (Enlarge: 38KB) |
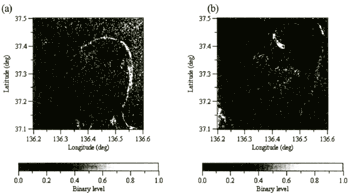 |
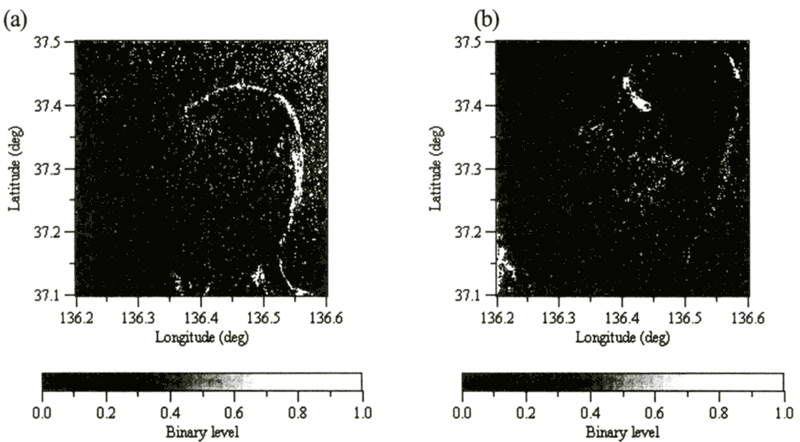
Figure 5. Binary image extracted from RADARSAT images ((a) January 11, 08h 52m(UT), (b) January 11, 21h 07m(UT))
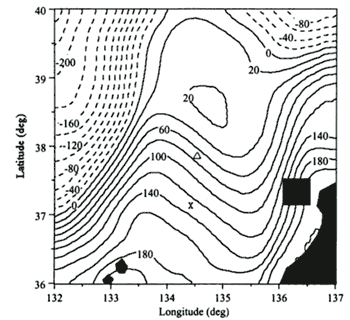
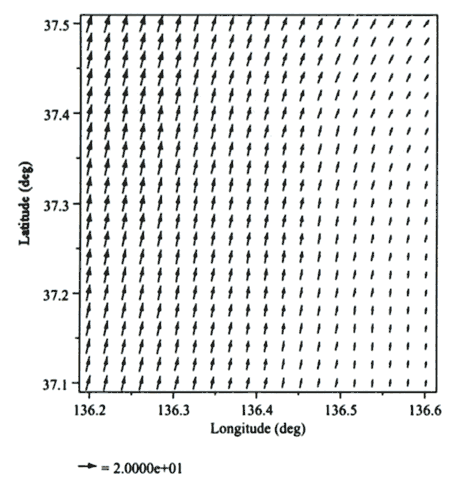
Based on the dynamic sea surface height along the four TOPEX/Poseidon orbits the sea surface topography of the study area is estimated. Though the dynamic sea surface height along the orbits is available every 6.5 km, the distance between the orbit extends more than 200 km. Furthermore, the time difference of one week exists between the orbit 10 and 203. An objective analysis using the distance function (Thiebaux and Pedder, 1987) is carried out to estimate sea surface topography for the study alea. It is of characteristics that the estimated sea surface topography is an average in terms of spatial and temporal scales. Figure 8 shows the estimated dynamic sea surface topography derived from TOPEX/Poseidon from January 7-14, 1997 including the two dates of spilled oil signatures extracted from RADARSAT. It can be seen that the sea surface height increases toward the coast of Japan Sea and the sea surface gradient is large around the extracted study area (rectangular hatched area in Fig.8). Figure 9 shows the geostrophic current vectors derived from the dynamic sea surface topography from January 7-14, 1997. Most current directions are toward north and the current speed ranges from 4.1 to 23.4 cm/sec. Component geostrophic current speed Vc can be calculated as follows (Strub et al., 1997).

where Vc is the geostrophic current speed, g is the acceleration of gravity, f is the Coriolis parameter, h is the sea surface height, s is the coordinate along the orbit, i is the index of the coordinate grid point, and n is the half span of the centered difference. In this study a span of four TOPEX/Poseidon intervals (n=2) is used to produce a 26 km difference.
Table 2. Major specifications of TOPEX/Poseidon
| Sensors |
NASA dual-frequency (C- and Ku-band) altimeter |
| CNES single-frequency (Ku-band) solid-state altimeter |
| Orbit |
1336-km, circular 66 degrees inclination |
| 10-day repeat of ground track (± 1km accuracy) |
| Sea level measurement accuracy 4.2cm |
|
Figure 6. Sea surface topography analysis procedure for extracting geostrophic
current vector
| (Enlarge: 32KB) |
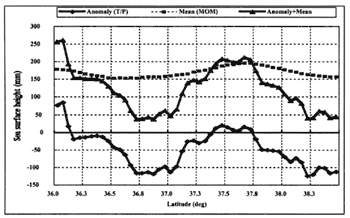 |
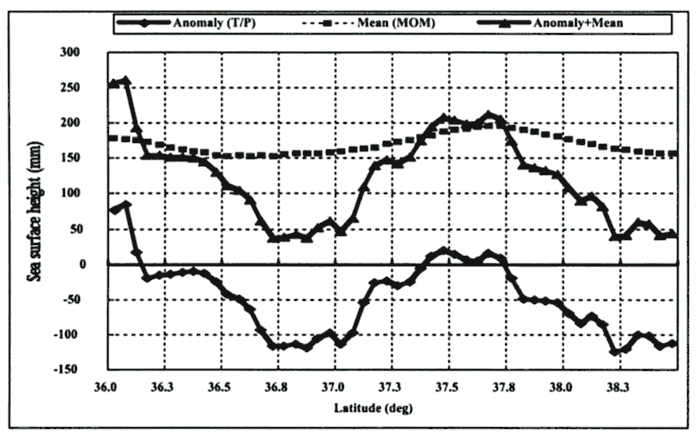
Figure 7. Comparison of various sea surface heights along the orbit 25, cycle
159 of TOPEX/POSEIDON, January 7, 1997. Mean represents mean sea surface height simulated by the model
(GFDL MOM).
Figure 8. Estimated dynamic sea surface topography derived from TOPEX/Poseidon
from January 7-14, 1997. (Contour interval is 20mm. X and △ indicate the location of sunken tanker
Nakhodka and the JMA buoy 21002, respectively. Rectangular hatched area shows the extracted area including
spilled oil signatures from RADARSAT.)
Figure 9. Geostrophic current vector derived from the dynamic sea surface
topognphy from January 7-14, 1997. (The maximum and minimum current speeds are 23.4 and 4.1cm/sec,
respectively. Unit: cm/sec)
ADEOS/NSCAT and wind-induced drift vector
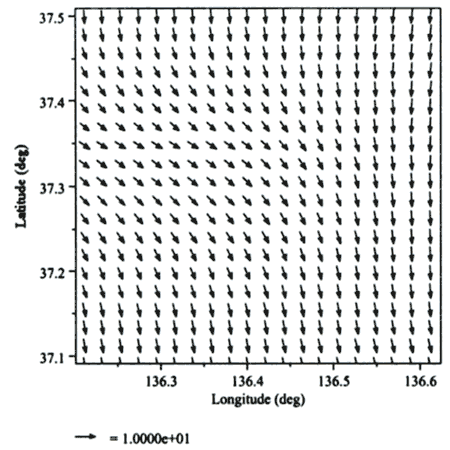
NSCAT is the abbreviation of NASA Scatterometer onboard ADEOS (Advanced Earth Observing Satellite) launched in 1996 and ceased its operation in June 1997 because of the power failure of ADEOS. Major mission requirements of NSCAT are listed in Table 3. In this study W25 product with 25 km spatial resolution is used for the analysis. Since the W25 products along each orbit are not spatially gridded in terms of latitude and longitude, W25 products are resampled every 25 km by using the nearest neighbor method (Lillesand and Kiefer, 2000). An example of wind vector distribution in January 11,01h 53m (UT) is shown in Figure 10. Wind directions are mostly north to northwest and the wind speeds range from 4.3 to 7.4 m/sec. Based on the sea surface wind vectors the wind-induced drift vectors are derived from the wind drift model.
Table 3. Major mission requirements of ADEOS/NSCAT
| Wind speed |
2m/s(rms) (for 3-20m/s) |
| Wind Direction |
20deg.(rms) (for 3-30m/s) |
| Spatial Resolution |
50km (Wind Cells) |
| Location Accuracy |
25km(rms) (Absolute) |
| Coverage |
90% of ocean every 2days |
|
Figure 10. Example of wind vector distribution in January 11, 01h 53m. (The
maximum and minimum wind speed are 7.4 and 4.3m/sec, respectively. Unit:m/sec)
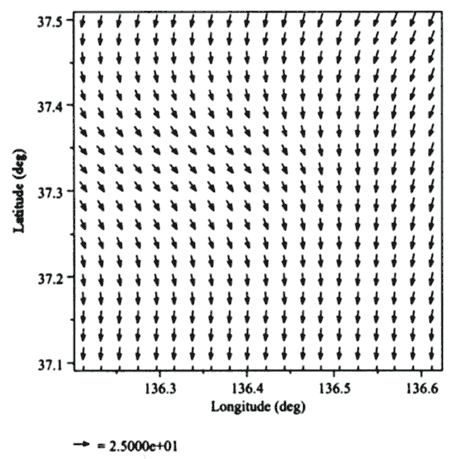
Figure 11. Example of wind-induced drift vector distribution in January 11.
01h 53m(UT). (The maximum and minimum speed are 22.2 and 12.8 cm/sec, respectively. unit: cm/sec)
The wind drift model is defined as that the drift speed is 3% of the wind speed and the drift direction is 15 degrees to the right of the wind direction in the northern hemisphere (Espedal, 1999). Figure 11 shows an example of the wind-induced drift vector distribution in January 11. 01h 53m (UT).Drift directions are toward south to southeast and drift speeds range from 12.8 to 22.2cm/sec. |