|
MATERIAL AND METHODS
German FerryBox project
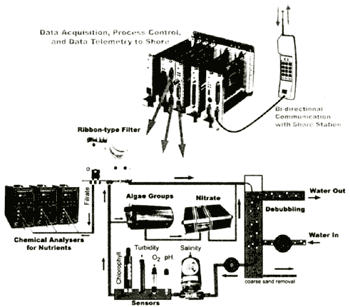
The "German FerryBox" consists of a fully automated flow-through system with different sensors and automatic analysers. Figure 1 shows a schematic drawing of the German FerryBox system. Water is pumped into the ship from an inlet in front of the ships cooling system. A debubbling unit removes bubbles, which may enter the system during heavy seas. At the same time coarse sand particles which may be introduced in shallow harbours and which settle and tend to block the tubes are removed as well. Coupled to the debubbler is an internal water loop in which the seawater is circulated with a constant velocity of about 1 m/s. This already decreases the tendency for building bacterial slimes on sensors and tube surfaces. A small part of the water is filtered by a ribbon-type filter for automatic nutrient analysis. This type of filter has the advantage of regularly providing new filter material, therefore avoiding bacterial processes which may influence the measured concentration of nutrients (trace analysis). The system contains motor valves and control sensors, e.g., pressure and flow, for automatic operation. For a reliable unmanned operation the system is supervised by an industrial programmable logic control which can shut-off the system in case of very severe errors and operates automatic cleaning cycles, e.g., in harbour. Data acquisition, data storage and data transfer to shore is controlled by an industrial standard PC (Pentium II). Data can be transferred to shore and the system can be remotely operated by GSM (mobile phone).
Bio-fouling is prevented by cleaning of the sensors with tap water and rinsing with acidified water or under severe conditions (tropics) by chlorination. Sometimes clogging of the water inlet in the ship interface by debris or fish causes problems. Since all flow rates are supervised by the system in such cases an automatic pressure back-flushing cycle is initiated which clears the inlet.
| (Enlarge: 54KB) |
 |
Figure 1. Schematic drawing of the German FerryBox system
At the time being, the FerryBox has sensors and analysers for the following parameters:
From these sensors especially the analysers for nutrients and the sensor for algal groups should be mentioned:
Nutrient analysis is carried out by chemical analysers which automatically
carry out the same procedures which are applied in standard marine chemistry manually in the laboratory:
1) Nitrate analysis is carried out by reduction of nitrate to nitrite (Cd-reductor)
and formation of an azo dye ( Grasshoff, 1983). 2) o-phosphate is determined by formation of a blue phosphomolybdate complex
according to the method of Koroleff ( Grasshoff, 1983). 3) Silicate analysis is carried out according to the method of Grasshoff ( Grasshoff, 1983).
The analysers are automated batch analysers with variable optical path length,
manufactured by ME Grisard, Trappenkamp, Germany. In addition a new optical method for nitrate determination
is under test: By measuring the spectrum of sea water from 200 nm to 400 nm and applying a multi-component
analysis to the known spectra of nitrate, bromide and humic substances nitrate can be measured quantitatively
in the range from about 1 μmol/1 to 100 μmol/1 (automatic change of path length) ( Petschatnikov
et al., 2003)
Algal groups are measured by sequential fluorometric excitation with
five LED's (blue, green, yellow, orange & red) and measurement of the emitted fluorescence signal. By
careful calibration phytoplankton with distinctive different pigment patterns can be distinguished, e.g.,
green algae, blue-green algae and diatoms. The instrument is now under test during the cruises. In regular
intervals samples are taken and plankton is counted and chlorophyll measured by HPLC for comparison.
Table 1 gives an overview of the specification of the different sensors/analysers. The stated accuracies in the table are derived from data of the manufacturers and from experience on similar test systems. At the time being, a quality assurance program for qualifying all ferry modules is under way.
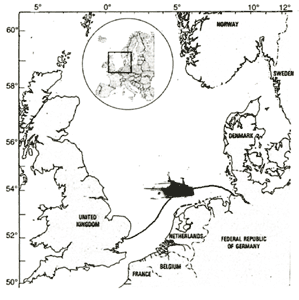
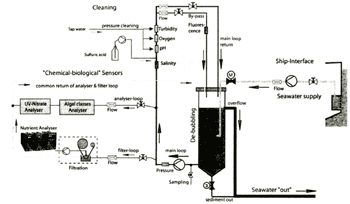
The first installation of the system has been taken place on the ferry between Hamburg (Cuxhaven) and Harwich and is under test since November 2001. Figure 2 shows the DFDS ferry route and a photo of the ferry. As shown the ferry route covers the southerly part of the North Sea and crosses the waters flowing from the English Channel to the North. Unfortunately, in March 2002 the ferry route has been shortened, it now starts from Cuxhaven missing the inner Elbe estuary. Figure 3a shows a detailed line diagram of the water system with all main components. In Figure 3b a photo of the water system on board the ferry is shown.
|
Table 1: Accuracies of sensors resp. analysers
|
| Parameter |
Range |
Accuracy |
Resolution |
Uncertainties or bias due to flow system |
| water temperature |
-10 to 50℃ |
0.1 ℃ |
0.01 |
due to water inlet |
| salinity |
0 to 50 |
0.02 |
0.001 |
due to very small bubbles |
| turbidity -E&H |
0 to 9999 FNU |
10% |
0.001 FNU |
due to very small bubbles 2) |
| turbidity-Turner |
0 to 50 NTU |
to be tested |
0.05 NTU |
due to very small bubbles 2) |
| dissolved oxygen |
0 to 20 mg/l |
0.2 % F.S. |
0.01 |
3) |
| pH |
0 to 15 |
0.1 |
0.01 |
|
| chlorophyll-Turner |
0 to 200 ug/l |
10% |
0.5 |
uncertainties due to changing fluorescence yield, influenced by high turbidity |
| ammonia |
0.1 to 30 μmol/l |
15% |
0.00 1 |
|
| nitrate |
0.5 to 500 μmol/l 1) |
15% |
0.01 |
|
| o-phosphate |
0.2 to 50 μmol/l 1) |
150/o |
0.05 |
|
| silicate |
0.1 to 100 μmol/l 1) |
15% |
0.0 1 |
|
| algal groups |
1 to 200 μg/l chloroph. |
to be tested |
5 μg/l |
accuracy depending on calibration and algal group 4) |
|
|
| 1) |
With two different optical path lengths and dilution at larger concentrations. |
| 2) |
Normally only bubbles > 2 mm are occurring in the system; they are removed by the
debubbling unit. It has to be tested if under certain conditions much smaller bubbles can occur which
would mainly disturb the turbidity measurement. |
| 3) |
In similar system it could be proven that the pumping system does not distort the
measurement of oxygen under normal conditions in the sea. However, it has to be tested what will be the
error at situations with extreme under-or over-saturation. |
| 4) |
The method can only measure algal groups that have been calibrated. If another group
appears it will be sorted into a wrong group. Algal groups with similar pigments may have a large error
(Ruser, 2001). |
|
| (Enlarge: 78KB) |
 |
Figure 2. Ferry route with photo of the ferry "Admiral of Scandinavia"
| (Enlarge: 42KB) |
 |
Figure 3a. Line diagram of the water system
Figure 3b. Photo of the water system onboard the ferry
As can be seen from the photo, the system consists of many components, many of them enabling a save automatic operation (the chemical analysers are not shown; they are located in a compartment above the flow unit together with cooled reagent reservoirs).
RESULTS AND DISCUSSION
Since November 2001 measurements were obtained regularly (one day Hamburg to Harwich, second day Harwich to Hamburg).
Results from one cruise in May 2002
In Figure 4 results from a cruise in May 2002 are shown.
In the following section some typical patterns of the measurements during springtime will be discussed:
Part A of Figure 4: Temperature, salinity & turbidity
In the temperature curve, the higher temperatures at the coastal waters (Cuxhaven and English coast) can be seen. The salinity curve near Cuxhaven shows the fresh water outflow of the river Elbe, whereas the decrease near Harwich is only marginal. It is also evident that along the Dutch coast lower salinities are observed than in the English Channel. This is due to fresh water influence of the Ijsselmeer and the river Rhine. Near Harwich a high turbidity is measured which is characteristic of the coastal areas at the English coast. Despite the low salinities off Cuxhaven the turbidity is not too high since the turbidity zone of the Elbe estuary is located in the inner estuary near Brunsbuttel.
Part B of Figure 4: Total chlorophyll concentration & algal groups
The total chlorophyll concentration shows two maxima, one near Cuxhaven and one between the English Channel and the Dutch coast. The maximum near Cuxhaven is typical for the first spring bloom in front of the Elbe estuary. The main reason for this could be the high nutrient concentrations (see Part D) in combination with the relatively moderate turbidity (light availability). In this peak diatoms are dominant, however also green algae exist. The second chlorophyll peak at the Dutch coast is the first mass occurrence of algae in this area in spring. Here, green algae and diatoms are both prevailing. We will see later that this algal bloom is not stationary over time (see below).
Part C of Figure 4: pH and oxygen concentration
The pH varies between 7.9 and 8.4 pH units. Near the Elbe estuary (Cuxhaven) the values are lower due to the fresh water input. However, other low values can be found near Harwich where the freshwater influence is negligible. Since here the oxygen concentrations are low, turbidity is high and ammonium is high as well, one could guess that oxygen consumption processes of re-suspended sediments will contribute to these lower pH values. As expected, pH and oxygen also show maxima at the chlorophyll peaks, thereby reflecting the higher primary productivity of these areas.
Part D of Figure 4: Ammonium and nitrate concentrations
Within the ferry profile the nitrate concentrations are varying between 0.1 and 90 μmol/l (1.5-1400 μg-N/l) and the ammonium concentrations vary between 0.1 and 1.3 μmol/l (1.5 - 18 μg-N/l). The largest nitrate concentrations are measured near Cuxhaven due to high nitrate input from the river Elbe. Near the English coast the largest ammonium concentrations are found whereas nitrate is slightly enhanced. One astonishing result is the broad maximum between km 300 and km 430 which can be found during most ferry cruises in spring and summer. At the time being its origin is unclear.
Chlorophyll results from cruises January to October 2002
After presenting a transect at one time it will be interesting to observe the
development of the algal bloom from the beginning in March. In Figure 5
a contour plot of the chlorophyll concentrations from Harwich to Cuxhaven is depicted for the time interval
between January and October 2002. On the vertical axis the time is depicted; the horizontal axis shows
the distance from Harwich ( compare the map in Fig.4). The chlorophyll concentrations
are colour-coded from small values (light gray; 2-7 μg/l) to large values (dark gray to black; 14-22 μg/l).
As can be seen, until the end of February no algal growth exists. This starts between 180 km and 220 km
in early March. Later in April plankton growth occurs along the whole Dutch and German coast. In early
May this bloom breaks down, leaving only the patches at 150 km and 560 km - as already shown in Figure 4. Then again in June some patches occur between 250 and 500 km. From mid of August only very small chlorophyll
concentrations occur.
Figure 5 only reflects measurements along the
ferry transect. It cannot decided if the decrease of chlorophyll concentrations along the Dutch and German
coast reflects a break down of algal populations or if the large "algae patch" was drifting out of this
transect.
|