|
CALCULATION RESULTS
Using floating architectural building model called PUKARI-Pier in Tokyo Bay near Yokohama City, the calculation was done. In accordance with an evaluation procedure, we calculated that the expected wave (height and period) of 1-year return period and the wave response analysis, and we evaluated the habitability. Location point for the demonstration and picture of PUKARI-Pier are shown in Figures 2 and 3.
Figure 2. Location point
Figure 3. Yokohama MM21 PUKARI-Pier
1-year expected value of wave height and wave period
Wave data for the calculation of 1-year expected value were obtained from NOWPHAS (Nationwide Ocean Wave information network for Ports and Harbours) for maximum value on daily observation annual report 1991-2000 by Coastal Development Institute of Technology. The expected value of significant wave height was calculated by the linear approximation of the moment method by Gumbel.
Table 3. Significant wave of 1-year return period (Yokohama)
| Significant wave |
Wave height (m) |
Wave period (s) |
| Average value |
0.51 |
3.48 |
| Maximum expected value |
1.42 |
4.93 |
|
With regard to the expected value of significant wave period, after grasping the correlative relation of the dispersion diagrams of wave height and period, and by the approximation line using least squares method, the 1-year expected value was obtained. Table 3 shows the average value and the maximum expected value of significant wave in terms of 1-year return period. 0.51 (m) of average significant wave height was obtained at Yokohama point and 3.48(s) of wave period was shown in Table 3. Maximum expected value of the wave height denoted 1.42(m), the wave period was 4.93(s). Significant wave height over 2 (m) and wave period over 10(s) were not obtained, because its point was located inside Tokyo Bay.
Properties of calculation model
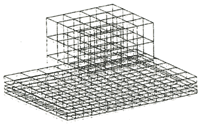
The numerical calculation model for wave response analysis was assumed with reference to size of PUKARI-Pier as shown in Figure 4.
| Length of building |
χ1,y1,z1 |
(m) |
14.4,14.4,10.8 |
| Length of floating |
χ2,y2,z2 |
(m) |
28.8,21.6,3.6 |
| Young'modulus |
E |
(N/m2) |
2.1×10¹¹ |
| Mass per unit volume of structure |
ρs |
(kg/m3) |
8.0×10³ |
| Draft |
D |
(m) |
2.0 |
| Depth of water |
d |
(m) |
15.5 |
|
Figure 4. Calculation model and properties
Wave response analysis
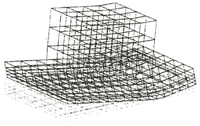
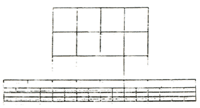
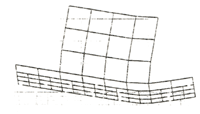
Table 4 shows displacement response results by time history expression, displacement amplitude of both bird's-eye view and cross section by average value and the maximum value shown in Table 4. Figure 5 shows incident wave direction, and shows nodal points for the evaluation of habitability on the line AB. Figure 6 shows the displacement amplitude at nodal point 1-5 of roof part of building in vertical direction by average of significant wave (height and period) and the maximum expected value. Figure 7 shows the displacement amplitude at nodal point 1-9 of the base. All of calculations adopted 1-year return period.
Point 1 of the building, logically, showed different results obtained from the average value of significant wave and maximum expected value, because of different magnitude of input wave forces, also it can be seen at base part. But, at Point 5 of the building and Point 7 of the base, those responses induced by the average and maximum obtained the almost same values, respectively. Calculation results at Point 1, 5 and 7 of the base were shown in Table 5 by numerical values. Particularly, concerning to the response of the building, the response results at the incident wave side can be seen, but as approaching to the leeside, the responses of the average and maximum denoted the almost same values. This difference can be judged by different wave period or wavelength.
Table 4. Displacement amplitude of calculation model
| |
Average Value |
Maximum expected value |
| Bird's-eye view |
 |
 |
| Cross-section |
 |
 |
|
Figure 5. Incident wave direction and nodal point of calculation model
Figure 6. Displacement response of nodal point (Building)
Figure 7. Displacement response of nodal point (Base)
Table 5. Displacement response of nodal point (Base)
| Significant Wave |
Displacement (cm) |
Frequency(Hz) |
| 1 |
5 |
7 |
| Average value |
10.0 |
7.0 |
6.0 |
0.27 |
| Maximum expected value |
65.0 |
20.0 |
5.0 |
0.20 |
|
As the third step of the present procedure, using the result at Point 5 of the base, we had evaluated the habitability in vertical motion.
Evaluation of performance level for habitability
After plotting the results shown in Table 5 into Figure 8 of the diagram of performance level domain, the evaluation for habitability in vertical motion was examined.
Figure 8. Performance level domain for evaluation of habitability in vertical
motion
Present result obtained by 1-year average significant wave indicated 0.07 (m) at 0.27 (Hz), and the evaluation showed the work level. This level may regard not to hurt working condition by standing position. The response result of the displacement by maximum expected value shows 0.20 (m) at 0.20 (Hz) in Table 5, and its result was plotted into discomfort level nearby work level domain.
As the results, the calculation by average expected value of 1-year of the significant wave does not influence the work condition keeping standing position. But the maximum expected value will bring the difficulty to working condition by standing potion, and it can be supposed to make the work efficiency go down by perception of motion.
CONCLUSION
In order to evaluate the habitability for floating oceanic architectural buildings, we have presented and studied as the followings:
(1) Definition of the habitability limit state relating to performance level; dairy living, office work like deskwork and work at factory.
(2) Wave load effect of 1-year return period.
(3) Proposal of an evaluation diagram in vertical motion using published various standards.
(4) The analytical procedure to the evaluation for habitability.
Assuming the floating model, the response calculation was preceded in accordance with present procedure and the validity of its procedure was confirmed. Using these response results, the performance level in vertical motion was evaluated. In calculation results of the floating model at Yokohama, the evaluation showed the work level in vertical motion by 1-year average value of significant wave, and also the other showed the discomfort level by maximum expected wave. In the future, and for the design of oceanic architectural buildings, we consider it is essential to secure the safety not only structural limit state but also the habitability limit state caused by oscillation and vibration, and also for this goal, the estimation of rational load effect in terms of 1-year return period dealing with dairy/ordinary load must be elucidated.
REFERENCES
Adachi. D., Y. Saito and O. Saijo. 2001. Study on Evaluation of Habitability for Floating-Type Oceanic Architecture 1st Report, Evaluation of Vertical and Horizontal Motion, Proceedings of Technical Paper of 44th Annual Meeting of College of Science and Technology Nihon Univ. Session of Ocean Architectural Engineering. Ja-4 pp.658-659 (Written in Japanese).
Architectural Institute of JAPAN (AIJ). 1991. Guidelines for the evaluation of habitability to building vibration (Written in Japanese).
Coastal Development Institute of Technology. NOWHPAS (Nationwide Ocean Wave information network for Ports and Harbours). observation annual report 1991-2000 (Written in Japanese).
ISO2631/2-1989-02. 1989. Evaluation of human exposure to whole body vibration Part 2-Evaluation of human exposure to vibration in buildings.
Kamekawa, K., Y. Saito and O. Saijo. Study on Evaluation of Habitability for Floating-Type Oceanic Architecture 2nd Report, Case Study by Rigid Body Model, Proceedings of Technical Paper of 44th Annual Meeting of College of Science and Technology Nihon Univ. Session of Ocean Architectural Engineering, Ja-5 pp.660-661 (Written in Japanese).
Masumo, Y., O. Saijo, Y. Saito, H. Eto and K. Kamekawa. 2002. Response Analysis
of Floating Artificial Base and Building by Wave Forces, Proceedings of ESDA2002, 6th Biennial Conference
on Engineering Systems Design and Analysis, ESDA2002/APM-091 pp.1-8.
Saito, Y. and O. Saijo. 2002. Load Effect of Habitability Level acting on Oceanic
Architectural Buildings -1-year Expected Wind Speed at 6 Points of Coastal Zone around Tokyo Bay-, Journal
of JACZS (Japanese Association Coastal Zone Studies) No.14, pp.167-174 (Written in Japanese).
|