SECTION 1. INTRODUCTION
On 2 December 2000, the European Commission initiated an examination procedure concerning an obstacle to trade, within the meaning of Council Regulation (EC)No 3286/94*, consisting of trade practices maintained by Korea affecting trade in commercial vessels**.
The procedure aims at determining whether Korea has bestowed any subsidies onto Korean shipyards which are incompatible with the WTO Subsidies and Countervailing Measures (the "ASCM') which caused injury or adverse trade effects on the EU shipyards or threat thereof.
The Korean Shipbuilders' Association (''KSA" hereinafter) and its members, the shipyards in Korea, have requested us to analyse different aspects of the development of the shipbuilding market worldwide and in Korea and the EU in particular.
Our task was to depict the evolution of capacity, production and sales of the commercial vessels subject of the TBR procedure and to determine the comparative advantages and weaknesses of the EU and Korean shipyards.
In our analysis, we have attempted to determine whether the EU shipyards have been affected as was alleged in the TBR Complaint lodged by the Committee of European Union Shipbuilders Associations (the ''CESA Complaint" hereinafter) and, where we found some injury or adverse trade effects experienced by EU shipyards, to determine the causes thereof.
In making our investigation and drawing our analysis, we have made use of publicly available sources of data and information and cross-checked where multiple data sets are available.
* 0.J. No L394, 31 December 1994, p.72 as last amended by Regulation (EC) No 356/95 (0.J No L 41, 23 February 1995, p.3), hereinafter referred to as the TBR Regulation
** 0.J NoC345, 2 December 2000, p.5.
All the source data is identified in the paper, which we submit herewith, and which sets forth the results of our investigation and analysis. Should the European Commission wish to obtain further data and material which we may have at our disposal, we will be pleased to cooperate in submitting such data.
Drewry Shipping Consultants Ltd***
Professor Aubrey Silberston
*** A description of the expertise of Drewry Shipping Consultants Ltd. in the field of shipbuilding and the shipping market as well as the CV for Professor Aubrey Silberston are attached to the present paper.
SECTION 2. THE INTERNATIONAL SHIPBUILDING MARKET
The status and development of the shipbuilding market cannot be assessed separately from the international shipping market which it, in theory, should follow. However, in practice, various distortions exist which affect this linkage. For instance, over-ordering by shipowners means that the equilibrium of the market is often distorted. Furthermore, ordering in different sectors does not always follow the same cycle.
The factors all lead to an uneven workflow for shipyards, which they have to plan and cater for. As well as workload, the newbuilding price fluctuates along with the shipping market cycle.
Therefore in order to have a clear grasp of the developments and status of the shipbuilding market and the factors influencing this market, an accurate assessment must be made of the shipping market and in addition, the status of both markets must be assessed over a period of time well in excess of three years.
2.1 International Seaborne Trade
Shipping plays a vital rote in the world economy. Some 80% of international trade is moved by sea, and in 2000 the international commercial fleet carried over 5.0 billion tonnes of cargo of all types.
In the fast two decades world seaborne trade has increased on average by 1.8 % per annum. Seaborne trade can be split into three principal commodity groups, with further subdivisions within each group. The breakdown being as follows:
Bulk Liquids: Comprising Crude Oil; Refined Petroleum Products; Bulk Liquid Chemicals; Liquefied Petroleum Gas (LPG); Liquefied Natural Gas (LNG); Vegetable Oils and Fats and chemical Gases. Total bulk liquid movements are now close to 2.3 billion tonnes per annum, of which crude oil and refined petroleum products account for nearly 90% of all traffic. On average bulk liquid trades have grown by approximately 1% per annum in the period 1980-1999, although in sectors such as LNG annual growth rates are near 7.5%.
・ Dry Bulks : Comprising Major Bulks such as Coat, Iron Ore and Grain, and Minor Bulks such as Steel Products, Fertilisers and Minor Ores and Minerals. Total dry bulk movements are now close to 1.9 billion tonnes, with trade growth in the period 1980-1999 averaging 2.0% per annum.
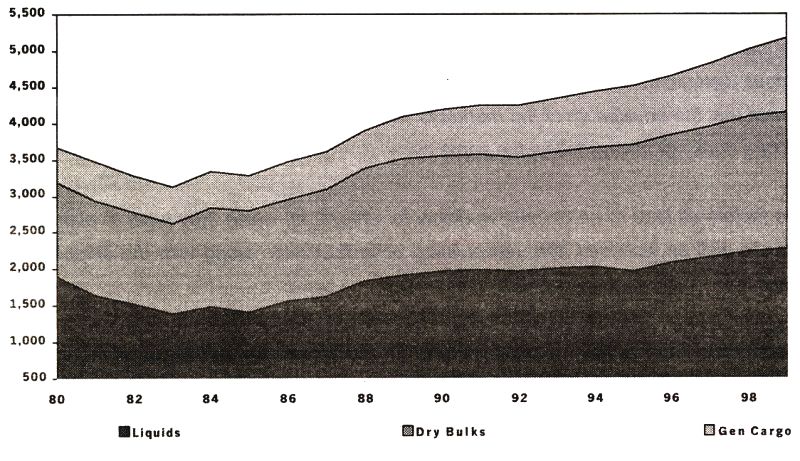
Figure 2.1 International Seaborne Trade (Million Tonnes)
(拡大画面: 88 KB)
Source: Drewry Shipping Consultants Ltd
・ General Cargo: Comprising all other non-bulk cargo, including refrigerated cargo such as meat and fruit and manufactured goods. An increasing proportion of this trade is being containerised, as opposed to being carried in conventional general cargo ships. Total general cargo trade is now over 1.0 billion tonnes a year, and has grown just under 4% per annum in the period 1980-1999. The average increase in the container sector is, however, close to 9%, which has created an enormous demand for new ships, and for absolute increases vessel size.
Apart from cargo, it is worth noting that in the cruise sector passenger demand has been growing at some 8% per annum, although unlike the other sectors of shipping which are demand led, the cruise market has been supply driven. That is, operators have stimulated demand by adding increasing numbers of larger cruise ships.
2.2 The Sectors of International Shipping
The different types of cargo require different types of ship. In broad terms the principal segments in the deep-sea commercial sector are:
・ Oil Tankers; carry crude oil, refined petroleum products and in some cases bulk liquid chemicals.
・ Chemical Tankers; carry bulk liquid chemicals, vegetable oils and fats and sometimes refined petroleum products.
・ LPG Carriers; carry liquefied petroleum gas and chemical gases
・ LNG Carriers; carry liquefied natural gas.
・ Dry Bulk Carriers; carry all major and minor dry bulk cargoes.
・ Refrigerated Ships (reefer ships); carry cargoes such as meat and fruit.
・ Container Vessels; carry all types of general cargo which has been containerised.
・ General Cargo Vessels; carry all types of general cargo that has not been containerised
・ Ro-Ro; roll-on/roll-off vessels carry trucks and cars.
・ Cruise ships; carry People.
・ Passenger ferries/ro-pax; carry people, cars and trucks
In addition, there are other specialist sectors, such as car carriers, but in the main these are small both in terms of the volume of cargo moved by the sea and the size of the respective fleets.
2.3 The International Shipping Fleets
In this Report there are continued references to the units used to measure both the size of a ship and its cargo carrying capacity. To avoid any confusion, the main definitions are as follows:
・ Deadweight Tonne (dwt); The total weight a ship can carry, including cargo, provisions, fuel, stores, crew and spares.
・ Gross Ton (gt); The total of all the enclosed spaces within a ship, expressed in tons, each of which is equivalent to 100 cubic feet.
・ Compensated Gross Ton; a measurement of shipbuilding output and capacity, which is derived by applying OECD agreed co-efficients to either dwt or gt figures to arrive at a measure of the amount of work involved in building a ship. In short, the amount of work involved in building one ton of a cruise ship will be far greater than one ton of a bulk carrier.
・ Light Displacement Tonnage (ldt); The weight of a ship's hull, machinery, equipment and spares. This provides an indication of the amount of steel in the vessel.
・ Twenty Foot Equivalent Unit (Teu); The normal unit for measuring the carrying capacity of a container ship.
・ Length Overall (loa); the length of the ship expressed in either metros or feet.
・ Draught (drft); depth or height of the submerged part of the ship when she has no cargo, expressed in either metres or feet.
・ Beam (bm); the breadth of the ship measured from the outside hull amidships, expressed in either feet or metres. In the shipping market some ships are classified as Panamax units. This is because they have a beam, which allows transit of the Panamax Canal (max 323 metres). Hence, references to post Panamax container vessels refer to ships with a beam that does not allow transit of the Canal.
According to Lloyd's Register of Shipping the world fleet of self- propelled merchant ships of not less than 100 gross tons equates to approximately 85,000 vessels. The cargo carrying fleet is approximately 45,000 ships, although many of these ships are small (less than 1,000 gross tons) and, as such, are of little interest to international shipbuilders who are geared up for larger ship construction.
The deep-sea fleets, which are of interest to international shipbuilders, covered by this Report comprise principally:
・ Oil Tankers; the existing fleet of ships over 10,000 dwt consists of approximately 3,400 ships of 295 million dwt. Oil tankers can range in size from a few hundred tonnes to over 500,000 dwt. The bulk of the international fleet is concentrated, however, between 10,000 and 300,000 dwt. In terms of newbuilding costs, a 300,000 dwt tanker, normally referred to as a vlcc, currently has a newbuilding cost of approximately US$80.0 million.
・ Chemical Tankers: the existing fleet of ships over 1,000 dwt comprises just under 1,500 vessels with a combined deadweight of 18.5 million dwt. The ships are much smaller than the oil sector and there are very few dedicated chemical tankers above 50,000 dwt. However, due to the fact that the ships normally have a large number of tanks, often made of stainless steel, newbuilding costs per dwt are much higher than an oil tanker. The current newbuilding price for a 37,000 dwt full stainless steel chemical tanker being in the order of US$ 65 million.
・ LPG Carriers: The commercial fleet is comparatively small - just under 1,000 units with a combined cubic carrying capacity of 13.5 million cubic metres. The fleet ranges in size from under 1,000 cu.m to ships of 80,000 cu.m, which is equivalent to approximately 55,000 dwt. Once again newbuilding costs are high, a large gas carrier of 78,000 cu.m having a newbuilding cost of approximately US$ 60.0 million.
・ LNG Carriers: The fleet is very small, but is growing rapidly. It currently consists of 128 units with a combined capacity of 14.2 million cu.m. The largest ships are approximately 138,000 cu.m, with an equivalent deadweight of 76,000 tonnes. Due to the expensive materials used in construction, LNG carriers are the most expensive type of commercial vessels afloat. To build a ship of 138,000 cu.m will cost around US$ 170-175 million at current market prices.
・ Bulk Carriers: The fleet consists of some 5,350 units over 10,000 dwt with a combined deadweight of 275 million dwt. Most of the commercial fleet ranges in size from 10,000 to 200,000 dwt. Conventional bulk carriers are simpler to build than most other ship types, hence they have lower unit newbuilding costs than other ship types.
・ Refrigerated Vessels; The ships are small in size, normally less than 10,000 dwt. The total commercial fleet consists, of some 1,340 units with a combined deadweight of 8.0 million tonnes. A large ship of say 550,000 cu.ft, the normal unit of cargo capacity, will however, have a current newbuilding cost of approximately US$ 33 million.
・ Container Ships: The fleet is expanding rapidly to meet the increases in trade and the switch of general cargo movements into containerised cargo. It currently consists of approximately 2,750 ships, with a combined deadweight of 70.0 million tonnes. Ship capacity is normally measured in terms of Teu's, with the largest ships now having capacity in excess of 7,000 teu. In dwt terms this equates to just over 100,000 dwt These large vessels are expensive to build and have a current newbuilding cost in excess of US$ 70.0 million. The trend towards larger tonnage however has benefited Korean yards because this type of vessel falls into the areas where Korean yards, with their volume approach, have a competitive advantage. Nonetheless, European yards have also benefited, with most of the feeder vessel orders going to Europe.
・ Cruise Vessels: There are various sub-sectors, but the international cruise fleet consists of some 350 ships. Ship size is normally measured in terms of berth capacity and gt, and there are now ships on order in this sector with a gt of 150,000 tons, and a berth capacity in excess of 2,500. Large cruise ships are complex to build and hence expensive. A ship of 150,000 grt with a berth capacity could well have a newbuilding cost in excess of US$ 400 million. Hence, although small in number, cruise ship orders are high value and, as such, are the sole focus of some shipbuilders, principally located in Europe. In contrast, passenger ferries are less sophisticated vessels operating principally on short sea routes
Overall, the sectors providing volume building in terms of ship numbers are oil tankers, dry bulk carriers and containerships. In addition, although small in number cruise ship and LNG contracts represent very high value work.
One other general point that is worth mentioning about the world's commercial fleets is that ships have a finite life. In fact, most of the ships in the fleet described above will be removed from service between 25 and 30 years of age. Thus the age profile of the fleet in any sector will have a bearing on the demand for replacement tonnage.
Table 2.1
Main Commercial Fleets - Jan 1st 2001
| Sector |
No. |
Total Fleet |
Unit |
| Oil Tankers |
3,422 |
294.9 |
M.dwt |
| Chemical Tankers |
1,493 |
18.5 |
M.dwt |
| LPG Carries |
962 |
13,465 |
‘000 Cu.m |
| LNG Carries |
128 |
14,202 |
‘000 Cu m |
| Bulk Carries |
5,364 |
274.9 |
M.Dwt |
| Refrigerated Vessels |
1,342 |
8.0 |
M.Dwt |
| Container Ships |
2,745 |
70.3 |
M.Dwt |
Source: Clarkson
Currently, there is an overhang of early 1970's built tonnage in both the oil tanker and dry bulk carrier sectors that will need to be replaced in the next few years. In addition, following a wake of well-publicised disasters, there are now moves afoot to remove single hulled tankers from the fleet. At the moment almost 180 of the 295 million dwt tanker fleet is single hulled and up to 90.0 million dwt of these single hulled ships will be removed from the market by 2005, if current proposals before the International Maritime Organisation (IMO) are ratified.
2.4 The Shipping Market Cycle and Shipbuilding
The shipbuilding market should, in theory, follow the movement of the international shipping market. However, in practice, various distortions exist which affect this linkage.
These factors, referred to below, all lead to an uneven workflow for shipyards, which they have to plan and cater for.
Firstly, shipowners tend to order (possibly over-order) most new ships when freight rates and market expectations are in the ascendancy. So-called ''counter cyclical" investment has been uncommon.
Given that there is a lead-time between ordering and delivery, which, on occasion, can be sufficient to see significant reversals in global economic direction and/or the fortunes of particular key industries (e.g. steel making), shipowner's decisions can end up being seemingly misguided. Moreover, it also suggests that shipbuilders have to work out ways to deal with "feast and famine" periods in their workloads.
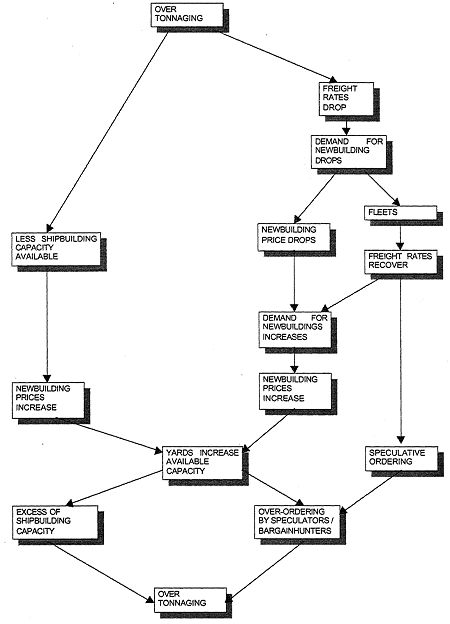
Figure 2.2 on the following page provides a broad illustration of the dynamics of the shipping market cycle, demonstrating the uneven workflows that all shipyards have to contend with. Starting from a situation where over-tonnaging exists in the shipping market, the excess supply of vessel capacity will have two major effects. In the short term, downward pressure will be exerted on freight rates, while in the longer term, less shipbuilding capacity will be available for new ordering, exerting an upward pressure on newbuilding prices.
Secondly falling freight rates will reduce the demand for new ships, which will have two effects - a shrinking fleet (as newbuildings are reduced and scrapping increased), and falling newbuilding prices. The shrinking fleet will lead to tonnage becoming in short supply, thereby exerting upward pressure on freight rates. This, combined with the falling newbuilding price, will encourage owners to increase their demand for newbuildings, thereby driving up newbuilding prices.
Previously, slack demand would have released shipbuilding capacity on to the market, and rising newbuilding prices would encourage yards to increase the available capacity either by increasing productivity or by introducing new facilities.
Figure 2.2
Shipping Market Cycles
This increase in shipbuilding capacity wilt eventually lead to excess shipbuilding capacity in the market and, coupled with the speculative ordering which will be encouraged by a rising freight market, eventually lead to over-ordering by speculators and bargain-hunters, which will cause an over-supply of tonnage to appear on the market. When the market is once again characterised by over tonnaging, the cycle wilt begin again.
The cyclical nature of the shipping market means that, not only do yards have highly variable workloads, but, in addition, the level of newbuilding prices in the market may fluctuate significantly according to market conditions.
Therefore, it is the prevailing conditions of the shipping market and the position in the shipping market cycle which will be the primary determining factor when it comes to setting a newbuilding price.
Furthermore, not all shipping cycles move at the same pace or in the same direction at any given time. One sector of the industry could be booming while another sector is in the doldrums. So the "feast and famine" equation may affect builders with different market specialities differently. Therefore, it would be more accurate to assess the relative fortunes of shipbuilders in relation to the sectors in which they specialise. Indeed, it could be misleading to compare the relative fortunes of shipyards which operate in different sectors of the industry, since their respective markets may be at different stages of the shipping market cycle, in which case, the ordering behaviour of shipowners in these sectors would be very different.
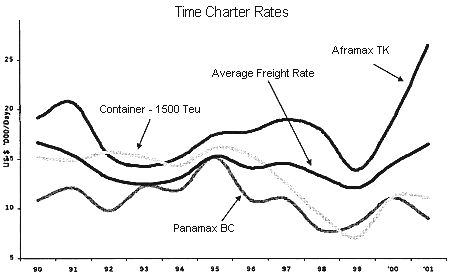
In terms of actual freight market performance, Figure 2.3 charts the trend in average daily time charter earnings for the three representative ship types in the period 1990 to 2000, together with a composite average for daily earnings for a whole range of ship types and sizes.
For much of the last decade freight market earnings for most ship types were at levels insufficient to cover both daily operating costs and capital charges for newbuildings. Put simply, on purely economic grounds and under most normal financing techniques, it would have been difficult to justify investment in new tonnage. This factor atone was one of the reasons why newbuilding prices were under downward pressure.
However, freight markets began to strengthen in the late 1990s, when much tighter balances between supply and demand in most sectors led to firmer freight rates. For example, average daily earnings for a very large crude oil tanker trading between the Arabian Gulf and Japan in 1999 were as low as US$ 20,000 per day (time charter equivalent basis). Whereas in 2000 the equivalent figure was US$ 52,000. This huge jump in earnings led to high levels of new ordering and, as a consequence, as berth availability for prompt delivery became tight, newbuilding prices started to firm.
Figure 2.3
Freight Market Rates
Source: Drewry Shipping Consultants Ltd
In conclusion, the shipbuilding market cannot be analysed properly without taking into account the development of the shipping market over a large period of time and also market conditions within a specific category.