9. IMPACT OF THE ASIAN CRISIS AND DEVALUATION OF THE WON
The CESA Complaint focuses on the period after 1997, which marked the start of the Asian crisis.
All of the newbuilding contracts with which the complaint is concerned are placed in US dollars, with the price being fixed on the date of contracting. Overall up to 80% of the materials and equipment will be sourced in Korea, with only 20% being sourced on the international market.
Accordingly, the dramatic fall in the value of the Won following the Asian crisis provided a dramatic boost to the competitive position of South Korean yards over all of their competitors including in particular Japan and Europe.
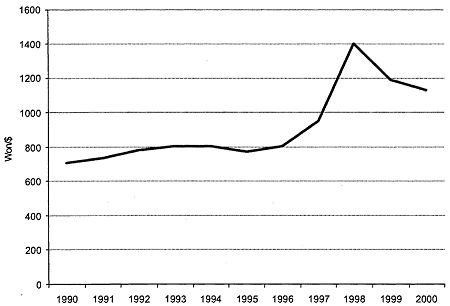
The impact of this can be seen from the graph below, which is based on monthly average exchange rate figures taken from the Financial Times:
It is apparent from this graph that Korean yards gained a huge advantage from the depreciation from an exchange rate of 800 Korean Won to the US dollar at the end of 1996 to 1,750 Won at the end of 1997. When the Won was at its lowest point in late 1997 Korean yards could have quoted a price over 40% below the prices at which they were quoting in 1996 and still received the same value in Won. Yearly average exchange rate figures from the IMF, which are shown in the Drewry Shipbuilding Report, show a lowest average exchange rate of 1,400 Won to the US Dollar during 1997. However, even on the basis of these averaged figures it is clear that Korean yards obtained a huge, and quite legitimate, advantage from the depreciation of the Won.
The exchange rate has not recovered to 1996 levels since the current rate is 1,300 Korean Won to the US dollar. This is still nearly 40% below the exchange rate of 800 Korean Won to the US dollar in 1996.
The CESA complaint focuses entirely on the period between 1997 and 2000, which matches the period following the collapse of the Korean Won against the US Dollar. It is clear against this background that one of the major factors which has allowed Korean yards to quote lower prices since 1997 was not illegal subsidies as alleged by CESA, but the depreciation of the Won against the US Dollar.
CONCLUSION
It is very clear that the depreciation of the Won against the US Dollar in 1997 made Korean yards more competitive and allowed them to quote lower prices than European and Japanese yards.
10. CONCLUSION - EFFECT OF THE COMPLAINT
The CESA allegations are strongly denied. European Yards lost their dominant position in the Shipbuilding market to Japan in the 1960s and 1970s before Korea built up any significant market share.
European Yards had already lost the ability to compete with either Korea or Japan for larger series built vessels such as tankers, bulk carriers and large container vessels well before 1997. Lower labour costs, much higher productivity and lower materials costs give Korea a decisive, and completely legitimate, competitive advantage in competing for these types of vessel.
In addition, the cost of materials has fallen and Korean yards have made further productivity gains since 1997. As a result Korean yards have been able to further improve their ability to quote competitive prices.
The depreciation of the Korean Won from around 800 Won to the US Dollar in 1996 to a low of around 1,750 Won to the Dollar in 1997 (yearly average for 1997 1400 Won), gave Korean yards a very substantial further competitive advantage over European yards since shipbuilding contracts are priced in US dollars.
Korean Yards do not enjoy subsidies from the Korean Government, unlike European yards who have enjoyed a range of both open and hidden subsidies over many years. European Yards are unable to compete because of high labour costs, lack of investment, high material costs and failure to achieve productivity levels matching the best Korean and Japanese shipyards. Korean shipyards are not to blame for any of these factors.
In addition, the following factors are important:
1. The availability of competitively priced ships is vital to the World economy which relies on shipping for the vast majority of international trade.
2. Europe's proposals that prices should be increased would adversely impact on renewal of the world tanker fleet, which is necessary to avoid further damage to the environment. Pending IMO rules which have been drafted in the wake of the tanker disasters of recent years provide that single skinned tankers will need to be replaced by double-hulled vessels by 2005. These are also EU initiatives aimed at phasing out single hulls.
3. If the IMO proposals are agreed as expected, around 90 million DWT of new double skinned tankers will need to be built over the next four years. This represents around 30%of the World tanker fleet. It is vital that these tankers are constructed at the most economic price.
4. The Third Party Submissions show that if the price levels at which European and Korean yards bid are similar owners would still choose to build in Korea because of non-price factors including quality, build time and delivery plus after sales service and re-sale value.
5. All of the Third Party Submissions oppose the CESA complaint on substantial grounds. Not one supports the CESA position.
6. Third Party submissions show that owners would not order from European yards even if prices for Korean vessels rose by 20% - 30% as CESA want. Owners would either reduce ordering or would order from Japan at lower price levels or from other yards in countries which may be outside WTO disciplines.
7. Korean yards are a major source of business for European suppliers of marine equipment for the 20% of the materials which are normally sourced outside Korea for vessels built for non-Korean owners. If prices were raised artificially then it is likely that orders would simply transfer to Japan or other countries outside the EU. In the case of Japan almost all of the materials used are domestically sourced and European suppliers of marine equipment would therefore lose out.
8. The Third Pan Submissions point out that even if the price charged by Korean yards to non- Korean owners was artificially raised by 20% - 30% the yards would remain free to sell vessels to domestic Korean shipowners at current economically justified price levels. This would result in European shipowners being at a competitive disadvantage.
For all the reasons set forth in the present paper and based on the economic analysis contained in the Drewry Shipbuilding Report, which should be read together with this Position Paper, the KSA submits that the complaint should be dismissed. Even if the EU wrongly concluded that Korea bestowed actionable subsidies upon its shipbuilding industry(which the KSA strongly denies), the facts prove that such subsidies can not have caused any injury or adverse trade effects. Hence, the prerequisite under the TBR Regulation foi the adoption of commercial measures is absent and no recourse to WTO dispute settlement is warranted.
At the same time. the KSA wishes to emphasise that the EU shipyards have for several decades benefited from openly granted or hidden EU subsidies, which the KSA submits are incompatible with the provisions of the WTO Subsidies Code. The TBR Regulation provides that in the assessment of whether to adopt commercial policy measures, the EU should take into account the broader Community's interests. The KSA believes that it would be against the EU's broader interests to challenge the compatibility of the alleged Korean subsidies for which sound legal arguments confirm the compatibility with the provisions of the WTO Subsidies Code while the EU itself has for years granted subsidies of which a substantial part are even contract-based.
The KSA, therefore, respectfully submits that the TBR examination procedure should be terminated upon a finding of absence of actionable subsidies inflicting injury or adverse trade effects.
ANNEX 1
COMPLETIONS BY YEAR
Year
Korea
Japan
AWES
Otheers
Total
Thou GT
%
Thou GT
%
Thou GT
%
Thou GT
%
Thou GT
%
1948
-
-
-
-
2,116
85.3
366
14.7
2,482
100
1971
-
-
11,132
45.6
10,391
42.6
2,865
11.7
24,388
100
1972
15
0.1
12,857
48.1
10,589
39.6
3,288
12.3
26,749
100
1973
14
0.0
14,751
48.5
11,865
39.0
3,779
12.4
30,409
100
1974
313
0.9
16,894
50.4
12,544
37.4
3,791
11.3
33,542
100
1975
410
1.2
16,991
49.7
13,070
38.2
3,732
10.9
34,203
100
1976
814
2.4
15,868
46.8
12,714
37.5
4,527
13.3
33,923
100
1978
582
2.0
11,708
66.8
10,731
39.0
4,531
16.5
17,532
100
1979
604
3.3
6,307
34.7
6,625
36.4
1,657
25.6
18,196
100
1980
495
3.5
4,697
32.9
4,686
32.8
4,411
30.9
14,289
100
1981
929
5.5
8,400
49.6
4,131
24.4
3,472
20.5
16,932
100
1982
1,401
8.3
8,163
48.5
3,864
23.0
3,392
20.2
16,820
100
1983
1,539
9.7
6,670
41.9
4,224
26.5
3,478
21.9
15,911
100
1984
1,473
8.0
9,711
53.0
3,499
19.1
3,651
19.9
18,334
100
1985
2,620
14.4
9,503
52.3
2,958
16.3
3,076
16.9
18,157
100
1986
3,642
21.6
8,178
48.5
2,059
12.2
2,966
17.6
16,865
100
1987
2,091
17.1
5,708
46.6
1,977
16.1
2,483
20.3
12,259
100
1988
3,174
29.1
4,040
37.0
1,715
15.7
1,980
18.2
10,909
100
1989
3,101
23.4
5,365
40.5
1,988
15.0
2,781
21.0
13,236
100
1990
3,441
23.2
6,663
44.9
2,910
19.6
1,826
12.3
14,840
100
1991
3,737
23.2
7,315
45.4
3,139
19.5
1,931
12.0
16,122
100
1992
4,520
24.5
7,852
42.6
3,268
17.7
2,804
15.2
18,439
100
1993
4,666
23.2
8,930
44.4
4,026
20.0
2,495
12.4
20,117
100
1994
4,230
21.8
8,643
44.6
3,691
19.0
2,820
14.5
19,384
100
1995
6,218
27.8
9,300
41.6
4,244
19.0
2,588
11.6
22,350
100
1996
7,374
28.7
10,182
39.7
4,865
19.0
3,245
12.6
25,666
100
1997
8,124
32.6
9,864
39.6
3,933
15.8
3,005
12.1
24,926
100
1998
7,243
29.0
10,206
40.9
4,424
17.7
3,107
12.4
24,980
100
1999
9,159
33.7
11,070
40.7
3,973
14.6
3,005
11.0
27,207
100
2000 P
11,806
40.6
11,318
38.9
3,514
12.1
2,463
8.5
29,101
100
Source : World Shipbuilding Statistics, Lloyd's Register
Note: 1. Ships over 100 GT
2. From 1996, Poland is included in AWES.
3. P: Preliminary
ANNEX 2
WORLD ORDER BOOK 1 JANUARY 2001
SHIPTYPE
SHIPSIZE
KOREA
JAPAN
EU
CHINA
POLAND
OTHERS
TOTAL SHIPS
TANKER
10〜60K DWT
67
16
20
27
10
30
170
60〜120K DWT
48
16
0
7
0
1
72
120〜200K DWT
45
6
0
0
0
7
58
200K + DWT〜
58
23
0
5
0
0
86
Sub-Total
218
61
20
39
10
38
386
BULK CARRIER
10〜40K DWT
12
43
2
35
0
2
94
40〜60K DWT
10
115
0
21
11
21
178
60〜80K DWT
48
100
0
26
0
2
176
80K + DWT〜
18
44
0
0
0
7
69
Sub-Total
88
302
2
82
11
32
517
CONTAINER
100〜499 TEU
0
0
0
2
0
3
5
Small
500〜999 TEU
0
4
21
9
1
7
42
1,000〜1,999 TEU
11
19
16
17
16
14
93
Medium
2,000〜2,999 TEU
23
4
25
0
32
15
99
3,000〜3,999 TEU
9
0
6
0
10
5
30
Large Post-Panamax
4,000〜8,000 TEU
128
24
1
13
10
3
179
Sub-Total
171
51
69
41
69
47
448
LNG
135-140,000 CBM
11
11
3
0
0
0
25
Sub-Total
488
425
94
162
90
117
1376
Total
513
477
612
293
144
627
2666
Sources:
1. Newbuilding Order book - Simpson Spence & Young
2. LNG - World Shipyard Monitor - Clarksons
3. Total - Lloyd's Register
Note: Norway is classified under EU