2. COST MODEL AND INITIATION OF TBR COMPLAINT
The timing of the CESA Complaint in November 2000 was clearly motivated by a desire to influence the outcome of the Commission review of State Aid to EU shipbuilding. The Complaint is not justified by any wrongdoing on the part of Korean yards. In particular, KSA submits that the Cost Model on which the CESA Complaint also relies is not an appropriate yardstick for the assessment of whether subsidies were granted and, if so, whether such subsidies inflicted injury or adverse trade effects. Hence, the Cost Model can not support the initiation of the TBR investigation or any findings at the end of the TBR examination.
The Commission concluded from the "Cost Model "that there was a prima facie case that Korean yards have concluded shipbuilding contracts at prices which do not cover their costs. This model is not valid for a number of reasons:
・ Profitability can not be assessed on the basis of individual contracts, but has to be considered at company or shipyard level since it is determined by the workload levels and the contribution of all contracts towards the recovery of overall overhead and other fixed costs.
・ The use of CGT based calculations in making specific contract-by-contract assessments is not valid because of the general 'coarseness' of CGT as a measure. CGT may be the best available measure of work content but its crudeness means that it is only suitable for use at an aggregate level and not for contract-by-contract comparisons.
・ The allocation of non-direct costs to determine stand-alone contract costs is inappropriate, inaccurate and a cause for major differences in calculated costs.
・ The basis of the assumed mandatory 5% profit margin and a 10-13% band of acceptability is neither justified nor supportable. This is an artificial standard which does not constitute evidence of sales below cost or of the existence of subsidies.
・ The sample size is minute in relation to the overall contracting levels and consequently the results can not be representative of the broader situation.
・ The method of sample selection and the details of certain of the selected contracts potentially skew the results.
・ The accuracy of estimates made by a third party is not sufficiently good to be relied on.
・ The fact that the conclusions reached have been progressively revised downwards demonstrates the deficiencies of the Model.
The results of the Cost Model assessments have been progressively updated which demonstrates their inherent inaccuracy. The sample size is so small and potentially skewed by the selection procedure that it can not be considered to be representative of the overall situation in Korea or the wider Far East.
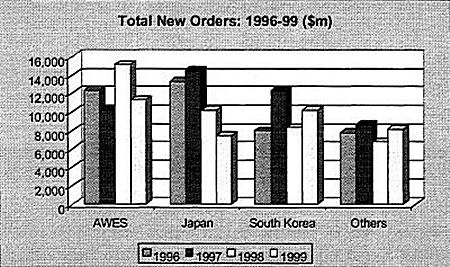
The Commission has used the Cost Model to focus only on Korean yards notwithstanding factual evidence demonstrating that it is not their policy to sell below cost to capture orders. The evidence shows that Japan is the market leader in the bulk carrier market, with 302 orders out of a World total of 517.Korea only has 88,China 82 and the rest of the world 45. This shows that Korea has not won orders for this type of vessel by bidding below cost since if they were able to do so Korean yards would be able to win a much greater share of the large bulk carrier market. It also raises the question of why the Commission has not investigated pricing by Japanese yards in the bulk carrier sector, but has chosen to only investigate Korean yards.
The Cost Model also ignores the fact that the competitiveness of a shipyard does not hinge solely on the price alone but on a combination of price and non-price factors which explains why some yards are more successful in certain sectors rather than others.
CONCLUSION
The results of the theoretical Cost Model do not provide any support for the conclusions reached by the Commission that Korean yards have been pricing below cost. In addition, the evidence from the low number of orders won by Korean yards in the bulk carrier sector is that Korea is not pricing below cost in order to win contracts.
In addition, findings based on the Cost Model provide an unreliable and inherently misleading basis for the assessment of subsidies causing injury or adverse trade effects. It uses a dumping based calculation which imposes a requirement for a mandatory 5% profit margin on every contract. This is inapplicable in the current procedure as dumping provisions and practice do not apply to commercial vessels which are not imported into the EU. In addition it adopts an arbitrary 10-13% band of acceptability without any independent rationale.
3. THE SHIPBUILDING MARKET
The Shipbuilding market is complex because it covers a wide range of vessels which serve different markets. In many of these the level of new ordering is heavily influenced by movements in the freight markets and the state of regional economies and the general World economy. In addition, ships have a finite working life and the age profile of the World fleet at any particular time will have an impact on ordering of new vessels.
It follows that the market is highly cyclical, with some sectors, which currently include tankers, being very buoyant for a period, followed by a period during which ordering is very low. Ordering in different sectors of the market such as tankers and dry bulk carriers does not follow the same cycles, and it follows that it is impossible to draw general conclusions from an increase in ordering in a particular vessel sector over a short period.
No assessment on whether the alleged Korean subsidies(which KSA deny exist)caused injury or adverse trade effects can be drawn without taking into account the effect of the characteristics of the shipbuilding market and, in particular, the cyclical nature of the various sectors of the shipbuilding market. Moreover, KSA submits that it is impossible to make an accurate assessment on the existence of injury/adverse trade effects or the causal effect of any alleged Korean subsidies based on a 3-year investigation period from 1997 through 1990.The development of the shipbuilding market and the position of the EU shipyards should be assessed over a substantially longer period. For this purpose, KSA describes below the recent development of the various segments of the world's shipbuilding market.
Tankers
Before the 1973 oil crisis most crude oil and refined products were shipped on vessels belonging to one of the major oil companies. However, a large proportion of the current tanker fleet is operated by independent owners.
As a result the demand for new vessels is highly dependent upon freight rates. In order to justify ordering a new VLCC, or a smaller Products tanker, an owner has to calculate whether the current and anticipated freight levels will allow him to recover his daily operating costs, and cover such items as depreciation. However, for most of the 1990s the freight markets were too low to allow an owner to recover both operating costs and depreciation and overheads, and accordingly the level of new ordering was low. In some cases owners would not even be able to cover daily operating costs and expenses.
The current situation is entirely different. There has been massive new ordering of tankers in 2000 as a result of a number of factors. One of these has been the increasing age of the tanker fleet, but a very important additional factor has been the increasingly stringent standards imposed by oil majors and charterers _ on tankers calling at their refineries and oil terminals. This lead to older tankers being phased out and orders being placed for new buildings. In addition new rules are coming into force requiring single hull tankers to be phased out in favour of doubled hull tankers. An additional factor over the last few years has been the steady increase in demand for oil.
All of the above has lead to a substantial number of new orders.
Bulk Carriers
The demand for bulk carriers is driven by the world economy for basic raw materials such as coal, iron ore and grain. It is therefore obvious that demand for new vessels will be influenced by the general World economy and can be dramatically affected by unpredictable events.
Container vessels
Container vessels represent an entirely different market sector, since demand for new vessels is being driven by the enormous expansion of container transport over the last 20 years. The market is also driven by fierce competition between the major container lines to extend their services, and to speed up and lower the cost of transportation per container. This has led to a demand for ever larger vessels which are required for delivery within a relatively short time scale frequently in the form of repeat orders.
In addition, the size of Post Panamax container vessels (up to 300 + metres in length) means that they belong to a completely different class from small and medium size vessels.
LNG vessels
Demand for LNG carriers has historically been dependent on the conclusion of long-term supply contracts for the carriage of liquefied natural gas from countries such as Indonesia to Japan, and is not directly therefore dependent on a spot freight market. The market for newbuildings is however dependent on the general level of economic activity and more recently has been heavily affected by the worldwide move towards greater use of gas for environmental reasons, and the discovery of large reserves of natural gas in areas which can not be developed using fixed pipelines.
A spot market for chartering LNG carriers is now developing, and as a result several speculative orders have recently been placed.
Cruise ships
The international cruise fleet of ships of all sizes consists of some 350 vessels. In contrast to other sectors of shipping this market has historically been supply driven, with operators being able to stimulate demand by adding new and more luxurious ships. Ship size has also increased in this sector and there are now ships on order with a GT approaching 150,000 tons and berth capacity in excess of 2,500.Ships of this type are both expensive and complex to build and can cost in excess of US$ 400 million.
CONCLUSION
There are many factors affecting the demand for vessels in different sectors, as a result of which demand is cyclical and does not develop in the same way throughout all sectors. In addition market trends can be temporary and it is not therefore possible or legitimate to draw conclusions based on a period of only three years.
4. EU AND KOREAN SHIPYARDS LARGELY OPERATE IN DIFFERENT MARKETS.
4.1 HISTORICAL PERSPECTIVE
European yards started to lose competitiveness in tankers and bulk carriers in the face of Japanese competition which developed in the 1960's and 1970's.This was before South Korean yards became established in the market, and can not therefore be blamed on Korean yards. The figures can be seen in Annex 1.
・ In 1948 AWES shipyards held 85% of the World market.
・ Japan entered the market in the 1950's and steadily increased market share during the 1960's.
・ European yards reached their highest volume of completions of 13 million GRT in 1975, by which time their market share had reduced to 38% and Japanese yards had increased market share to 49%.Prior to 1972 Korea had no market share at all and by 1975 had only achieved a market share of under 1%.
・ From 1975 onwards European yards steadily lost market share to 19% by 1985,when Japanese yards had increased their share to 53% in 1985.
・ Korean yards did not gain a market share above 8% until 1985 and it is clear that by then European yards had already lost their dominant position as a result of Japanese competition, and not as a result of competition from Korean shipyards.
・ Since 1985 Korean yards have increased their market share as a result of their competitive position. The figures for earlier years and for completions from 1997 to the end of 2000 show:
COMPLETIONS BY YEAR 1997-2000
(ANNEX 1)
| Year |
Korea |
Japan |
AWES |
| Thou GT |
% |
Thou GT |
% |
Thou GT |
% |
| 1948 |
- |
- |
- |
- |
2,116 |
85.3 |
| 1976 |
814 |
2.4 |
15,868 |
46.8 |
12,714 |
37.5 |
| 1985 |
2,620 |
14.4 |
9,503 |
52.3 |
2,958 |
16.3 |
| |
|
|
|
|
|
|
| 1997 |
8,124 |
32.6 |
9,864 |
39.6 |
3,933 |
15.8 |
| 1998 |
7,243 |
29.0 |
10,206 |
40.9 |
4,424 |
17.7 |
| 1999 |
9,159 |
33.7 |
11,070 |
40.7 |
3,973 |
14.6 |
| 2000 P |
11,806 |
40.6 |
11,318 |
38.9 |
3,514 |
12.1 |
| Year |
Others |
Total |
|
| Thou GT |
% |
Thou GT |
% |
| 1948 |
366 |
14.7 |
2,482 |
100 |
| 1976 |
4,527 |
13.3 |
33,923 |
100 |
| 1985 |
3,076 |
16.9 |
18,157 |
100 |
| |
|
|
|
|
| 1997 |
3,005 |
12.1 |
24,926 |
100 |
| 1998 |
3,107 |
12.4 |
24,980 |
100 |
| 1999 |
3,005 |
11.0 |
27,207 |
100 |
| 2000 P |
2,463 |
8.5 |
29,101 |
100 |
・ The statistics in Annex 1 show completions by European yards over the 1997-2000 period ranging between 12% and 17%.They also however show that figures for completions by European yards have remained within a narrow band since the early 1980's,ranging between a high of 20% in 1993 and a low of 12% in 1986.The figures also show that European yards achieved a broadly similar share of the World market in previous years, including the period 1986-1989 when the European share varied between 12% and 16%.
COMPLETIONS BY YEAR 1986-1989
(ANNEX 1)
| Year |
Korea |
Japan |
AWES |
| Thou GT |
% |
Thou GT |
% |
Thou GT |
% |
| 1986 |
3,642 |
21.6 |
8,178 |
48.5 |
2,059 |
12.2 |
| 1987 |
2,091 |
17.1 |
5,708 |
46.6 |
1,977 |
16.1 |
| 1988 |
3,174 |
26.8 |
4,040 |
34.1 |
1,715 |
15.7 |
| 1989 |
3,101 |
23.4 |
5,365 |
40.5 |
1,988 |
15.0 |
| Year |
Others |
Total |
|
| Thou GT |
% |
Thou GT |
% |
| 1986 |
2,966 |
17.6 |
16,865 |
100 |
| 1987 |
2,483 |
20.1 |
12,259 |
100 |
| 1988 |
1,980 |
18.2 |
10,909 |
100 |
| 1989 |
2,781 |
21.0 |
13,236 |
100 |
Against this background it is clear that the figures for market share won by European yards over the last few years are within the normal fluctuations to be expected in the shipbuilding industry.
・ As can be seen form Annex 3,the European AWES newbuilding orders increased from 4 million CGT in 1999 to 6.8 million tons in 2000,which represents a 70% increase in one year.
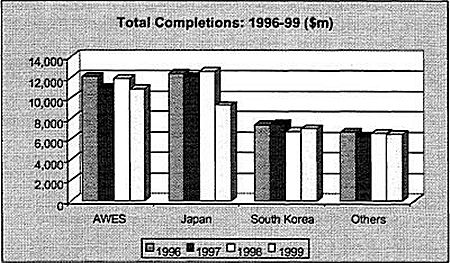
・ The figures for completions over the last 20 years(Annex 1)also show that European yards completions figures in gross tons(GT)have remained fairly consistent between 3-4 million tons since the beginning of the 1990's and are higher now than the figures achieved in the second half of the 1980's.
・ The upsurge in orders over recent years has been in areas such as tankers, bulk carriers and larger container ships, i.e. sectors which European yards had either exited long before entry by Korean yards or in which European yards are much less competitive than Korean and Japanese yards. Accordingly, the fact that European yards have not benefited to the same extent by the increased demand for these types of vessel is not a result of any unfair pricing by Korean yards.
・ The value of completions and Vessels on order at European yards outweighs the value of completions and vessels on order at Korean yards. Accordingly the figures for market share based on either GT or CGT paint only part of the picture.
Source AWES
Source AWES
・ The upsurge in orders for cruiseships in 1999 and 2000 has provided a massive benefit for European yards as can be seen from the Cruiseship order book, details of which are set out below:
CRUISE AND PASSENGER SHIPS ON ORDER
(Source Clarksons) |
| YEAR |
Number of ships |
GT (millions) |
| 2000 |
113 |
5.0 |
| 2001 |
130 |
6.0 |
Conclusion
Recent trends do not provide any evidence that European yards have lost any market share that they enjoyed prior to 1997 as a result of competition from Korean yards. On the contrary, the figures for completions by year in Annex 1 and information on the current total order book in Annex 2 show:
・ a normal pattern of fluctuation in market share in response to market conditions,
・ a relatively stable level of completions in terms of tonnage when compared to the 1980's and 1990's,
・ A 70% increase in the European order book in 2000,which disproves the CESA allegations,
・ An order book which is higher in value than the Korean order book. This reflects a decision by European yards to bid for high value vessels such as cruise ships.
・ The recent increase in orders has been for vessels where European yards are much less competitive than Korean and Japanese yards. This results from the fact that European yards are at a natural disadvantage when compared to Korean yards when labour costs and other factors are taken into account. It is also explained by the failure of European yards to invest and restructure to remain competitive in the face of competition from Japan and Korea.