クロアチア造船業統計資料 (その 10)
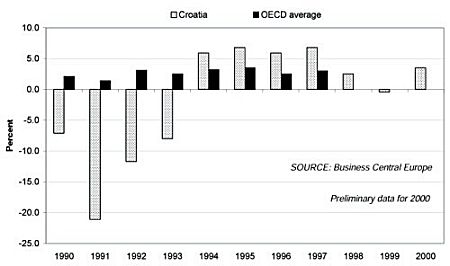
Croatia: Growth of Real GDP 1990-2000 (Annual Averages)
Croatia: Growth of Real GDP
|
|
croatia |
OECD
average |
|
| 1990 |
-7.1 |
3.0 |
|
| 1991 |
-21.1 |
1.3 |
|
| 1992 |
-11.7 |
2.1 |
|
| 1993 |
-8.0 |
1.4 |
|
| 1994 |
5.9 |
3.1 |
|
| 1995 |
6.8 |
2.5 |
|
| 1996 |
5.9 |
3.2 |
|
| 1997 |
6.8 |
3.5 |
|
| 1998 |
2.5 |
2.5 |
|
| 1999 |
-0.4 |
3.0 |
|
| 2000 |
3.5 |
4.3 |
(Preliminary) |
% change, year-on-year.
SOURCES: OECD, EBRD
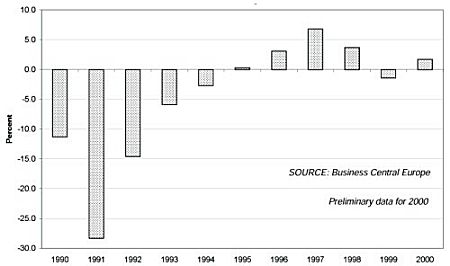
Croatia: Changes in Industrial Production 1990-2000 (Annual Averages)
Croatia: Changes in Industrial Production
| |
Croatia |
|
| 1990 |
-11.3 |
|
| 1991 |
-28.3 |
|
| 1992 |
-14.6 |
|
| 1993 |
-5.9 |
|
| 1994 |
-2.7 |
|
| 1995 |
0.3 |
|
| 1996 |
3.1 |
|
| 1997 |
6.8 |
|
| 1998 |
3.7 |
|
| 1999 |
-1.4 |
|
| 2000 |
1.7 |
(Preliminary) |
% change, year-on-year.
SOURCE: Business Central Europe
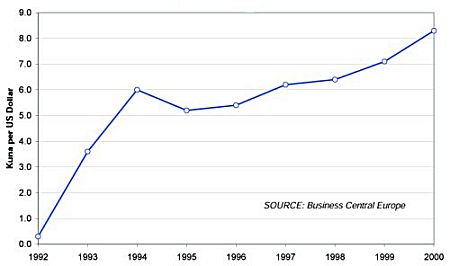
Croatian Kuna vs. US Dollar 1992-2000 (Annual Averages)
CROATIA: NOMINAL EXCHANGE RATES VIS A VIS US DOLLAR
| |
Kuna |
Peseta |
D-mark |
Yen |
Won |
|
| 1985 |
n.a. |
170.1 |
2.944 |
238.6 |
870.9 |
|
| 1986 |
n.a. |
140.0 |
2.172 |
168.5 |
881.0 |
|
| 1987 |
n.a. |
123.5 |
1.797 |
144.6 |
825.0 |
|
| 1988 |
n.a. |
116.5 |
1.756 |
128.1 |
730.0 |
|
| 1989 |
n.a. |
118.4 |
1.880 |
138.0 |
669.2 |
|
| 1990 |
n.a. |
101.9 |
1.616 |
144.8 |
708.0 |
|
| 1991 |
n.a. |
103.9 |
1.659 |
134.5 |
733.2 |
|
| 1992 |
0.3 |
102.4 |
1.562 |
126.7 |
780.0 |
|
| 1993 |
3.6 |
127.2 |
1.653 |
111.2 |
802.4 |
|
| 1994 |
6.0 |
134.0 |
1.623 |
102.2 |
804.3 |
|
| 1995 |
5.2 |
124.7 |
1.433 |
94.1 |
771.4 |
|
| 1996 |
5.4 |
126.7 |
1.505 |
108.8 |
804.4 |
|
| 1997 |
6.2 |
146.4 |
1.734 |
121.0 |
950.5 |
|
| 1998 |
6.4 |
149.4 |
1.759 |
130.9 |
1,400.5 |
|
| 1999 |
7.1 |
156.2 |
1.836 |
113.9 |
1,186.7 |
|
| 2000 |
8.3 |
181.9 |
2.138 |
107.5 |
1,122.7 |
Preliminary. |
Annual averages of daily rates.
SOURCE: Business Central Europe
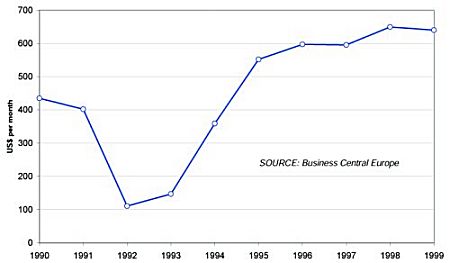
Croatia: Average Wages 1990-1999 (US$ per month)
Croatia: Average Wages 1990-99
| |
Croatia |
| 1990 |
435.1 |
| 1991 |
402.3 |
| 1992 |
111.0 |
| 1993 |
147.1 |
| 1994 |
359.2 |
| 1995 |
552.0 |
| 1996 |
597.2 |
| 1997 |
595.5 |
| 1998 |
649.5 |
| 1999 |
640.1 |
US$ per month.
SOURCE: Business Central Europe
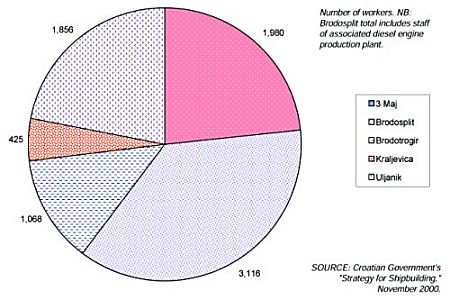
Croatian Newbuilding Yards' Workforce as at November 2000
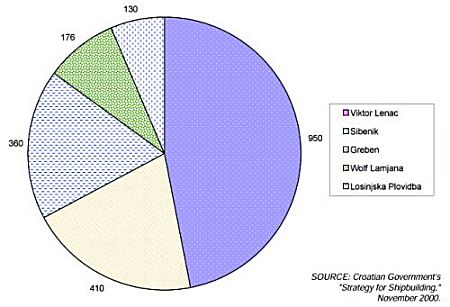
Croatian Shiprepair Yards' Workforce as at November 2000
Croatian Shipyard Employment
| Yard Name |
Workforce |
| Newbuilding Yards : |
|
| 3 Maj |
1,980 |
| Brodosplit |
3,116 |
| Brodotrogir |
1,068 |
| Kraljevica |
425 |
| Uljanik |
1,856 |
| |
|
| Newbuilding Yards Sub-Total: |
8,445 |
| |
|
| Repair Yards : |
|
| Viktor Lenac |
950 |
| Sibenik |
410 |
| Greben |
360 |
| Wolf Lamjana |
176 |
| Losinjska Plovidba |
130 |
| |
|
| Repair Yards Sub-Total: |
2,026 |
| |
|
| Grand Total: |
10,471 |
Figures as at November 2000.
SOURCE: Croatian government.
Shipyard Viktor Lenac: Consolidated Profit & Loss Account
|
|
1997 |
1998 |
1999 |
|
Operating revenues |
|
|
|
|
Service revenue: |
|
|
|
|
Domestic |
25,154 |
42,879 |
30,923 |
|
Foreign |
152,741 |
270,634 |
308,212 |
|
Total |
177,895 |
313,513 |
339,135 |
|
|
|
|
|
|
Other operating revenue |
33,805 |
7,811 |
7,133 |
|
|
|
|
|
|
Total operating revenues |
211,700 |
321,324 |
346,268 |
|
|
|
|
|
|
Operating expenses |
|
|
|
|
Costs of materials & parts |
33,331 |
67,030 |
57,653 |
|
Service costs |
81,110 |
133,637 |
118,883 |
|
Wages & related costs |
49,086 |
71,428 |
90,616 |
|
Depreciation |
9,717 |
10,998 |
17,601 |
|
Other operating costs |
13,996 |
18,566 |
21,421 |
|
Total operating costs |
187,240 |
301,659 |
306,174 |
|
|
|
|
|
|
Net operating profit |
24,460 |
19,665 |
40,094 |
|
|
|
|
|
|
Net financial expenses |
-577 |
-7,682 |
-27,933 |
|
Other income |
9,782 |
6,495 |
1,884 |
|
Other expenses |
-15,539 |
-4,570 |
-3,952 |
|
Profit before taxes |
18,126 |
13,908 |
10,093 |
|
|
|
|
|
|
Income taxes |
-35 |
-4,172 |
- |
|
Net profit |
18,091 |
9,736 |
10,093 |
|
|
|
|
|
|
Earnings per share on net profit |
17.14 |
9.17 |
17.14 |
Figures in '000 Croatian kuna.
SOURCE: Shipyard Viktor Lenac d.d.