丂
Japan
丂Edited by
丂Ship & Ocean Foundation
丂
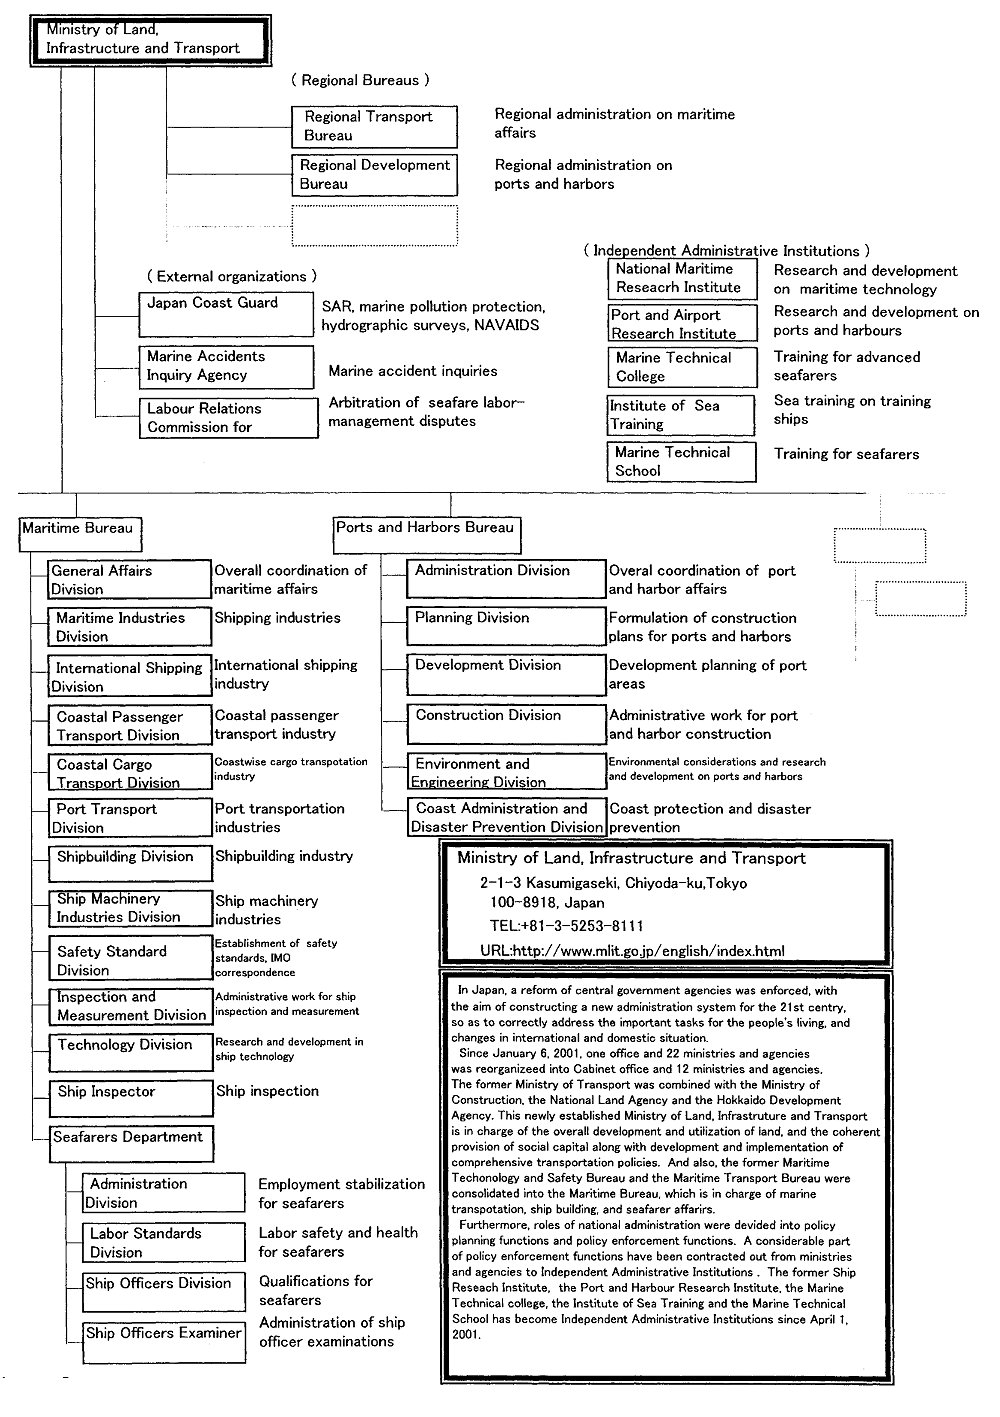
An Outline of Japanese Maritime Administration
乮奼戝夋柺丗 346 KB乯
丂
丂
Basic Data on Marine Transport (Japan)
(1) Role of marine transport
[1] International marine transport trade amount and percentage in Japan's entire international trade.
| |
Export (Unit: 1,000 tons) |
Import (Unit: 1,000 tons) |
| |
Total |
Marine |
Marine(亾) |
Total |
Marine |
Marine(亾) |
| 1997 |
103,080 |
101,932 |
98.9亾 |
777,210 |
775,908 |
99.8亾 |
| 1998 |
102,016 |
100,905 |
98.9亾 |
731,486 |
730,217 |
99.8亾 |
| 1999 |
103,281 |
101,995 |
98.8亾 |
750,343 |
748,855 |
99.8亾 |
丂
[2] Shipping amount and percentage in Japan's entire domestic cargo transport.
| |
|
Total |
Ship |
Railroad |
Truck |
Airplane |
| 1997 |
1,000 tons |
6,677,063(100亾) |
541,437(8.1亾) |
69,228(1.0亾) |
6,065,384(90.8亾) |
1,014(0亾) |
| Mil. ton丒km |
568,880(100亾) |
237,018(41.7亾) |
24,618(4.3亾) |
306,263(53.8亾) |
981(0.2亾) |
| 1998 |
1,000 tons |
6,397,912(100亾) |
516,647(8.1亾) |
60,369(0.9亾) |
5,819,881(91.0亾) |
1,015(0亾) |
| Mil. ton丒km |
551,555(100亾) |
226,980(41.2亾) |
22,920(4.2亾) |
300,670(54.5亾) |
985(0.2亾) |
| 1999 |
1,000 tons |
6,445,607(100亾) |
522,602(8.1亾) |
58,685(0.9亾) |
5,863,259(91.0亾) |
1,061(0亾) |
| Mil. ton丒km |
560,160(100亾) |
229,432(41.0亾) |
22,541(4.0亾) |
307,148(54.8亾) |
1,039(0.2亾) |
丂
[3] Marine passenger transport amount and percentage in Japan's entire domestic passenger transport.
| |
|
Total |
Ship |
Railroad |
Truck |
Airplane |
| 1997 |
Million people |
84,675(100亾) |
145(0.2亾) |
22,245(26.3亾) |
62,200(73.5亾) |
86(0.1亾) |
| Mil. person丒km |
1,418,805(100亾) |
5,368(0.4亾) |
395,238(27.9亾) |
944,972(66.6亾) |
73,243(5.2亾) |
| 1998 |
Million people |
84,068(100亾) |
128(0.2亾) |
22,013(26.2亾) |
61,839(73.6亾) |
88(0.1亾) |
| Mil. person丒km |
1,424,356(100亾) |
4,620(0.3亾) |
388,939(27.3亾) |
954,807(67.0亾) |
75,990(5.3亾) |
| 1999 |
Million people |
84,008(100亾) |
120(0.1亾) |
21,751(25.9亾) |
62,047(73.9亾) |
92(0.1亾) |
| Mil. person丒km |
1,424,482(100亾) |
4,470(0.3亾) |
385,101(27.0亾) |
955,563(67.1亾) |
79,348(5.6亾) |
丂
(2) Japanese merchant fleets
[1] Oceangoing vessels of 2,OOOGT or more.
| |
Japanese flag ships |
Foreign ships chartering |
Total |
| Number |
GT (1,000 tons) |
Number |
GT (1,000 tons) |
Number |
GT (1,000 tons) |
| 1997 |
182 |
12,376 |
1,839 |
55,005 |
2,021 |
67,381 |
| 1998 |
168 |
11,686 |
1,802 |
54,564 |
1,970 |
66,250 |
| 1999 |
154 |
11,283 |
1,842 |
55,987 |
1,996 |
67,270 |
丂
Percentage of cargos loaded aboard Japanese flag vessels in the whole cargos bound for and from Japan.
| |
Export |
Import |
| Jap. flag ships |
Chartered ships |
Total |
Jap. flag ships |
Chartered ships |
Total |
| 1997 |
1.9亾 |
37.5亾 |
39.4亾 |
16.6亾 |
53.6亾 |
70.2亾 |
| 1998 |
1.7亾 |
41.7亾 |
43.4亾 |
16.4亾 |
55.4亾 |
71.8亾 |
| 1999 |
1.4亾 |
34.7亾 |
36.1亾 |
15.8亾 |
54.8亾 |
70.6亾 |
丂
[2] Domestic shipping vessels exclusive of fishing boats, work boats, pleasure boats as of the end of March 1999.
| Sizes |
亙100GT |
100-200GT |
200-300GT |
300-400GT |
400-500GT |
500-700GT |
700-1000GT |
| Number |
2,115(29.1亾) |
1,782(24.5亾) |
320(4.4亾) |
314(4.3亾) |
1,413(19.4亾) |
469(6.5亾) |
275(3.8亾) |
| GT total |
69,778(1.9亾) |
313,764(8.6亾) |
83,847(2.3亾) |
110,763(3.0亾) |
684,689(18.7亾) |
313,573(8.6亾) |
236,815(6.5亾) |
丂
| Sizes |
1000-2000GT |
2000-3000GT |
3000-4500GT |
4500-6500GT |
6500GT亝 |
Total |
| Number |
222(3.1亾) |
129(1.8亾) |
126(1.7亾) |
67(0.9亾) |
37(0.5亾) |
7,269(100亾) |
| GT total |
325,961(8.9亾) |
352,687(9.6亾) |
463,579(12.7亾) |
352,930(9.7亾) |
348,680(9.5亾) |
3,657,066(100亾) |
丂
(3) Number of seafarers of Japanese nationality
| |
For foreign routes |
For domestic routes |
| 1997 |
4,561 |
35,123 |
| 1998 |
4,076 |
32,226 |
| 1999 |
3,703 |
30,635 |
丂
(4) Ports
(a) Amount of cargos handled at Japanese ports.
| |
All ports |
5 largest ports |
| 1996 |
3,465 mil. Tons |
894 mil. Tons |
| 1997 |
3,465 mil. Tons |
901 mil. Tons |
| 1998 |
3,165 mil. Tons |
797 mil. Tons |
Note: Five largest ports include Keihin (gateway to Tokyo and Yokohama), Nagoya, Osaka, Kobe, Kanmon.
丂
(b) Number of oceangoing/domestic shipping vessels entering Japanese ports.
| |
Oceangoing vessels |
Domestic shipping vessels |
Total |
| Number (1,000) |
GT (million) |
Number (1,000) |
GT (million) |
Number (1,000) |
GT (million) |
| 1996 |
117 |
1,699 |
6,840 |
2,532 |
6,958 |
4,231 |
| 1997 |
121 |
1,732 |
6,749 |
2,574 |
6,889 |
4,310 |
| 1998 |
116 |
1,685 |
6,504 |
2,357 |
6,640 |
4,046 |
丂
(5) Occurrence of marine disasters and marine pollutions
[1] Recent marine disasters occurred in Japanese territorial waters or involving Japanese flag vessels.
| |
Vessels rescued |
Dead or missing |
| 1997 |
1,678 |
2,565 |
| 1998 |
1,726 |
2,498 |
| 1999 |
1,920 |
2,625 |
丂
[2] Recent marine pollutions occurred in Japanese territorial waters or involving Japanese flag vessels.
| |
Oils |
Others |
Red tide |
Total |
| 1997 |
405 |
254 |
54 |
713 |
| 1998 |
388 |
283 |
26 |
697 |
| 1999 |
339 |
224 |
26 |
589 |
Note: Others include hazardous liquid substance, industrial wastes, factory waste water and blue tide.
|
|