擔杮嬤奀奀掙抧宍偺摦夋(僷僲儔儅奀掙抧宍)
Animation display of ocean bottom topography near Japan
塱揷丂朙丒楅栘丂嫓
Dr Yutaka Nagata and Dr Toru Suzuki
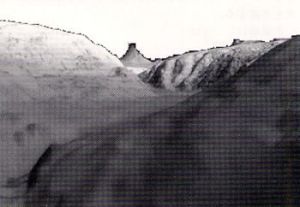
丂庬乆偺奀梞尋媶暘栰偱丄奀掙抧宍偵偮偄偰偺惓妋側忣曬偼旕忢偵廳梫偱偁傞丅偟偐偟丄奀悈偼岝傪捠偝側偄偨傔丄奀掙抧宍傪捈姶揑偵懆偊傞偺偼擄偟偄丅MIRC偺晛媦孾栔妶摦偺堦娐偲偟偰丄奀悈傪庢傝彍偄偨宍偱丄偁偨偐傕峲峴拞偺愽悈丒旘峴掵偺僼儘儞僩僌儔僗偐傜擔杮嬤奀偺奀掙抧宍傪挱傔傞傛偆側摦夋偲丄懡悢偺抧揰偐傜抧宍偺捁嵴恾傪摼傜傟傞傛偆側摦夋僜僼僩偺嶌惉傪峴側偭偨丅擔杮嬤奀傪16偺奀堟偵暘偗丄偦傟偧傟偺奀堟偱嫽枴怺偄奀掙抧宍傪挱傔傞偺偵揔偟偨愽悈掵偺1偮偺峲楬偲丄捁嵴恾傪尒傞偙偲偺偱偒傞暋悢偺抧揰傪愝掕偟偨丅偦偺拞偐傜弜壨榩奀堟傪椺偵偲偭偰愢柧偟傛偆丅恾1偵奀堟恾傪帵偡偑丄偙偺夋柺偱偼丄懠偵奀堟偺抧宍峔憿偺娙扨側愢柧傕梌偊偰偄傞丅偙偺奀堟偱偺戙昞揑抧宍偼榩幉偵増偭偰杒偵怢傃傞怺偄弜壨僩儔僼偱丄傎偲傫偳榩墱偵傑偱払偟偰偄傞丅恾偵栴報傪偮偗偨嬋慄偑帵偝傟偰偄傞偑丄偙傟偑愽峲掵偺峲楬偱偁傞丅弜壨榩偱偼斾妑揑扨弮側峲楬偑梊掕偝傟偰偍傝丄憡柾榩撪偐傜弌敪偟偰丄撿惣偵恑楬峲楬傪庢傝丄埳摛敿搰愭抂壂偐傜惣偵揮偠丄弜壨僩儔僼傪墶愗偭偨屻儖乕僾忬偺峲楬傪庢傞丅偦偺屻丄僩儔僼傪偦偺幉偵増偭偨宍偱丄壂崌偐傜恀杒偵恑傓丅偙偺晹暘偱偼愽悈掵偼恀捈偖晉巑嶳偵岦偐偆偙偲偵側傞丅摦夋偺堦応柺偲偟偰丄弜壨僩儔僼偺奀掙嬤偔偐傜丄奀掙嫭扟傪捠偟偰尒偨晉巑嶳傪恾2偵帵偡丅偙偺摦夋偱偼抧宍傪偲傜偊堈偄傛偆偵墧捈僗働乕儖傪悈暯僗働乕儖偵懳偟偰悢攞奼戝偟偰帵偟偰偄傞偺偱丄晉巑嶳偼幚嵺傛傝傗傗愲偭偰尒偊傞丅弜壨榩偺摦夋偱偼丄愽悈掵偼榩墱嬤偔偱嬻拞偵旘傃弌偟丄晉巑嶳偺壩岥偑挱傔傜傟傞偲偙傠偱廔傢偭偰偄傞丅
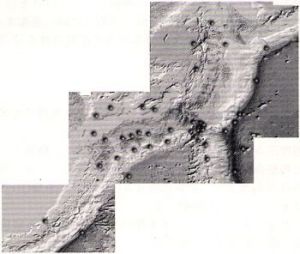
丂恾1偺抧恾偱偼丄2偮偺娵偄儃僞儞偑帵偝傟偰偄傞偑丄偙偺抧揰偱捁嵴恾傪摼傞偙偲偑偱偒傞丅偙偺奀堟偱偼2偮偟偐愝掕偟偰偄側偄偑丄擔杮嬤奀慡懱偱偼丄恾3偵帵偡傛偆偵46抧揰偑愝掕偝傟偰偄偰丄摿挜揑側丄偁傞偄偼嫽枴怺偄奀掙抧宍偺傎偲傫偳傪尒傞偙偲偑偱偒傞丅恾偺儃僞儞傪僋儕僢僋偡傞偙偲偵傛偭偰丄捁嵴恾偑摼傜傟傞偺偱偁傞偑丄帇揰偺崅偝偼奀柺傗傗忋偲丄偁傞掱搙偺崅搙偐傜偺2偮傪慖戰偱偒傞丅弜壨榩奀堟撿曽偺抧揰偺傗傗崅偄埵抲偐傜挱傔偨捁嵴恾傪丄偙偺僯儏乕僗儗僞乕偺昞巻偵帵偡偑丄慜弎偺摦夋傛傝傕丄捠忢傛傝報徾揑側挱傔偑摼傜傟傞丅抧恾忋偺儃僞儞偺偦傟偧傟偵2偮偺慄暘偑晅偗傜傟偰偄傞偑丄偙傟偼弶婜偺尒捠偟偺斖埻傪帵偡傕偺偱偁傞丅儅僂僗傪憖嶌偡傞偙偲偵傛偭偰丄悈暯曽岦偵360搙丄忋壓曽岦偵180搙丄帇慄偺曽岦傪曄偊傞偙偲偑偱偒傞(偦偺堄枴偱堦庬偺摦夋昞帵)丅
丂奀掙抧宍偵娭偡傞婎慴揑側僨乕僞偼500m儊僢僔儏偺J-EGG500傪梡偄偰偄傞偑丄増娸堟偱偼慹偡偓傞偺偱丄愺揷徍搶戝嫵庼偑嶌惉偟偨傛傝嵶偐偄僨乕僞僙僢僩(憡柾榩奀堟偱50x50m僌儕僢僪丄搶嫗榩奀堟偱偼90x90m僌儕僢僪)偺採嫙傪庴偗偰梡偄偰偄傞丅(愺揷嫵庼偼悈楬晹嵼怑拞偵J-EGG500偺嶌惉偵恠椡偝傟偨丅)棨忋偺抧宍偵偮偄偰偼崙搚抧棟堾偺50m儊僢僔儏偺僨乕僞傪梡偄偰偄傞丅2偮偺摦夋慡懱偑1枃偺CD-ROM偵廂傔傜傟偰偍傝丄捠忢偺僷僜僐儞偱傒傞偙偲偑偱偒傞傛偆偵側偭偰偄傞丅傢傟傢傟偺偙偺傛偆側帋傒偑丄懡曽柺偺曽乆偺偍栶偵棫偰傞傕偺偲峫偊偰偄傞師戞偱偁傞丅
丂
丂Accurate knowledge of bottom topography is essential for researches on ocean in various fields. However, seawater is too opaque for us directly to view ocean bottom scenery. As one of our efforts on popularization of oceanographic knowledge, we developed two kinds of animation displays of ocean bottom topography near Japan. One is walk through animation, in which you can see ocean-bottom scenery from a front glass of a submarine/flying boat. Another one is to show bird's eye views from various spots.
丂We divided areas near Japan into 16 sub-domains. One of the sub-domains, Suruga Bay area, is shown in Fig. 1. An explanation of the topographic feature is also given. In the map, there one line with arrow along which walk through animation is shown, and several round buttons (two in the case of Fig. 1 ) at the positions where bird's eye views are shown. The most spectacular topography in Suruga Bay is the very deep canyon, Suruga Trough, which extends northwards along the bay axis from offshore, and reaches almost the bay head. Here, we set rather simple navigation rout: the boat starts from the center of Sagami Bay, and goes southwestward along the coast of Izu Peninsula, and turns westward to cross Suruga Trough. After taking a circular path, it navigates northward along Suruga Trough. The rout is just pointing to Mt. Fuji. One example of the scenery from the front glass of the boat is shown in Fig. 2. You can see the configuration of Suruga Trough and Mt. Fuji faraway through the canyon. The boat comes out from sea surface near the bay head to fly over Mt. Fuji. You can see the crater of Mt. Fuji in the last scene of the animation. Vertical scale is taken as several times larger than horizontal scale in our animation, in order to illustrate the scenery more understandable. So, the shape of Mt. Fuji is a little sharpened than our real image.
丂The bird's eye view would give more concrete image on ocean bottom topography. If one of the round buttons in map of Fig. 1 is clicked, you will get the bird's eye view as shown in the face page of this News Letter. The height of the observing points can be selected whether a little above the sea surface or the higher level. The two segments attached to the round button in the map (Fig. 1 ) indicate the range of vision in the initial stage. Eye direction can be changed both horizontally for 360 degrees and vertically for 180 degrees by maneuvering the mouse. The bird's eye view well demonstrates the characteristic nature of Sagami Bay. The number of observing points is 46 in total (see Fig. 3 for their positions), and we believe that almost all of the important and speculative sceneries can be seen from these points.
丂We hope that our bottom topography animation of two kinds can give good sea bottom images for scientists and for public people. The total software described above is installed in a single CD-ROM, and can be operated by usual personal computer. The digitized bathymetry dataset, J-EGG500 (JODC-Expert Grid Data for Geography) of 500m x 500m grid is basically used in our animation displays. However, it is too coarse to display the detailed topography in coastal areas and bays. So, for several coastal sub-domains, we used much more detailed grid data (50 x 50 m grid for Sagami Bay, and 90 x 90 m grid for Tokyo Bay), which were provided by Prof. Akira Asada of University of Tokyo, who contributed to establish J-EGG500 when he was in Hydrographic Department, MSA. As to the height distribution on land, 50 x 50 m grid data provided by Geographical Survey Institute, Japan is used.
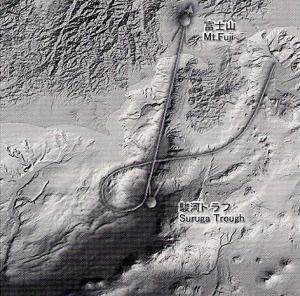
Fig. 1
Sub-domain map for Suruga Bay area. The line with arrow indicates the navigation rout of the submarine/flying boat. Round buttons indicate the spots, from where bird's eye views are available. Two segments attached to each of the round buttons show range of view in the initial stage.
丂
Fig. 2
View from the front glass of the boat, when it navigates along the axis of the Suruga Trough (see Fig. 1). Mt. Fuji is seen through the canyon.
丂
Fig. 3
Spots from where you can see the bird's eye views of bottom topography. 41 spots are prepared in total. JEGG500 bathymetry dataset is available in the region shown here.