At the initial state, the ocean is at rest and the density (σt) stratification (Figure 5) is based on the observational result at Station 112 in Figure 1.
The numerical method used in the present experiments is that of Suginohara (1981).
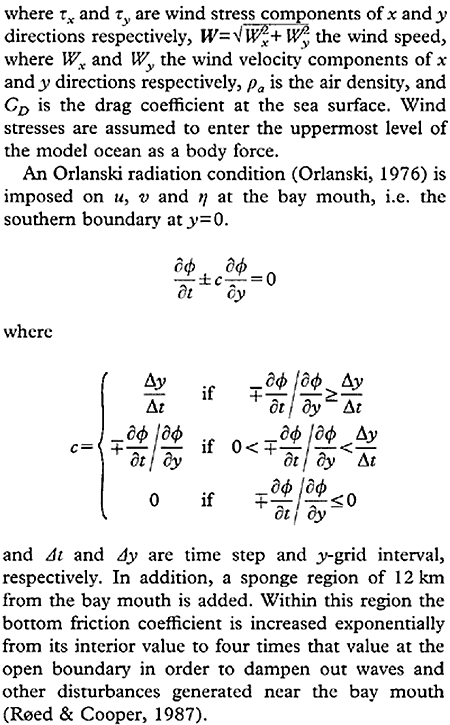
The following values are used for numerical computations; Δt= 10 s, Δx=Δy= 1 km, Δz= 1 m (up to 100 m at the lowest level), g = 9.8m s-2, f = 8.44 × 10⁻⁵ s-1, ρo = 1.0 × 10³ kg m-3 and ρa = 1.2kg m-3. The following values are based on previous numerical studies (Suginohara, 1982; Matsuyama et al., 1990); KH = 1.0 × 10⁻¹ m2 s-1, Kv = 1.0 × 10⁻⁶ m2 s-1 and CB =2.6 × 10⁻³. The drag coefficient CD and the eddy viscosity coefficients AH and AV are varied in each computation.
Results of numerical experiments
Northerly wind
We are interested in the upwelling phenomenon induced by the north-easterly wind near the bay head and along the eastern coast of Tokyo Bay in summer. The numerical experiment was performed to investigate in detail the formation of circulation and upwelling by steady wind in the stratified bay. Wind stress τx and τy was imposed as 0 and -3.9 × 10⁻² N m-2, respectively (which corresponds to 5 m s-1 of the north-easterly wind), until 72 h from the beginning of the computation. To suppress the initial perturbation, the wind stress was gradually increased during the first hour. In preliminary runs, the values of AH and Av are given as 1.0 × 10² m2 s-1 and 1.0 × 10⁻⁴ m2 s-1 respectively, and the value of CDD, 1.3 × 10⁻³, is the same as that of Matsuyama et al. (1990).
The computed horizontal velocity field and density (buoyancy B) distributions are shown in Animation 1. The distributions are selected of three depths, at 0.5 m, 7.5 m and 14.5 m, as representative of the surface, middle and lower layers, respectively. The current direction of the surface layer (at 0.5 m depth) almost agrees with the wind within a few hours, and it gradually tends to the west due to the earth's rotation effect. The current directions of the middle layer (at 7.5 m depth) and lower layer (at 14.5 m depth) are clearly different from that of the surface layer, i.e. south-east in middle layer and north-east in lower layer, respectively. The current field indicates the formation of a significant baroclinic flow by the northerly wind, i.e. along-bay (axial) component of wind. The velocities in the upper layer also indicate convergence at the western side and divergence at the eastern side of the inner bay. Therefore, the downwelling along the western coast and upwelling along the eastern coast in the inner bay are expected. On the other hand, the vertical circulation is due to the currents moving toward the bay mouth in the surface layer and toward the bay head in the lower layer. The steady state in the current field is formed within the inertial period of Tokyo Bay (about 21 h) by geostrophic adjustment (e.g. Gill, 1982). After this time, the averaged velocities of each layer are about 0.26 m s-1 in the surface layer, 0.05 m s-1 in the middle layer, and 0.03 m s-1 in the lower layer, respectively. A strong current shear exists between the surface and middle layers of the inner bay.
The density (buoyancy B) distributions in Animation 1 show that the upwelling caused by the north-easterly wind is seen along both the bay head and eastern side of the inner bay at 24 h from the beginning of computation. Thus the density contours lie parallel to the main axis of the bay, except at the bay head. The north-easterly wind causes the up-welling along the eastern coast and the downwelling along the western coast, and this pattern continues over time.