Since the OI scheme is univariate, the magnitude of the observation and background errors is not relevant, only their relative ratio. The ratio in magnitudes of the observation error to background error is 0.62.
The observations that were used are from the real-time GTSPP (Global Temperature Salinity Pilot Project) at NODC (National Oceanographic Data Centre, U. S. ). These include data from XBTs (eXpendable Bathy Thermographs), TAO moorings and drifting buoys. A manual quality control procedure was used to remove any observations which were believed to be wrong. Those that passed the quality control were linearly interpolated in the vertical onto model levels for the analyses which was done on each level independently.
The observations were assimilated into the ocean model as it was integrated. Every 10 days the model was stopped and the model state was used as the background for an OI analyses using observations which spanned a window five days either side of the model background. An increment to the background was calculated. To avoid exciting gravity waves, and to allow the model dynamics to adjust gradually to the changes in the density field, this increment was added slowly over the subsequent 10 days, after which a new background field was available, and the cyclerepeated. No change was made to the salinity field during the OI assimilation.
丂
Coupled model
Exactly the same ocean model was used for creating the analyses as for the coupled forecasts. The atmosphere model used is the ECMWF NWP IFS (Integrated Forecast System) model version 15R8, with a T63 spectral horizontal resolution and 31 vertical sigma levels. A coupler, OASIS (Ocean Atmosphere Sea lce Soil coupler) developed by CERFACS (European Centre for Research and Advanced Training in Scientific Computation, Toulouse) was used to interpolate between oceanic and atmospheric grids at coupling times (once per day).
丂
ANALYSES FOR THE 1990s
丂
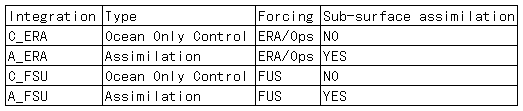
Four analyses for 1990 to October 1997 were carried out (summarised in table 1). In all integrations the surface temperature was relaxed to Reynolds (1988) values with a relaxation time scale of 3 days. They all used the same surface fluxes of heat and fresh water. These were taken from the ECMWF Re-analyses (ERA) for 1990 to the end of 1993 and from ECMWF operational fields (Ops) from Jan'94 onwards (as ERA stopped at the end of 1993). Two experiments were ocean-only controls (C_ERA and C_FSU) in which no sub-surface data were assimilated, while theother two experiments (A_ERA and A_FSU) had sub-surface data assimilated using the OI scheme described above.