If the slide reading results of peripheral laboratory worker are all correct, the prevalencc of error rate (Pa) among selected samples will become zero. If the results have some degree of errors, the rate will be different (Po) depending on each situation. Using these sample statistics we need to estimate the parameters (P) in the population and to set up the hypothesis such as bellow.
Null hypothesis (H0) : P = P0
Alternative Hypothesis (Ha) : P = Pa
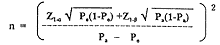
Now to calculate required sample size, we use the formula as shown in the Table 1 where Z1-α and Z1-β, represents Z values for one-tailed α error and β error. We set α error to be 5% whose type I error specifies the proportion of times we rejcct the null hypothesis when it is true, where Z1-α is 1.645.
Likewise we also set 5% of β error whose type II error specifies the proportion probability failing to reject the null hypothesis when it, in fact, is false but in this kind of situation, beta error becomes zero.
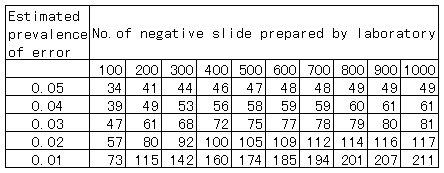
If the accepted limit of prevalence of error is 5% (type I error), and if PL keeps 100 negative slides for recheck, then 52 slides should be selected for rechcck. The sample size needs to be modified by using finite population correction factor. As a result, only 34 negative slides are minimum enough to select for recheck.