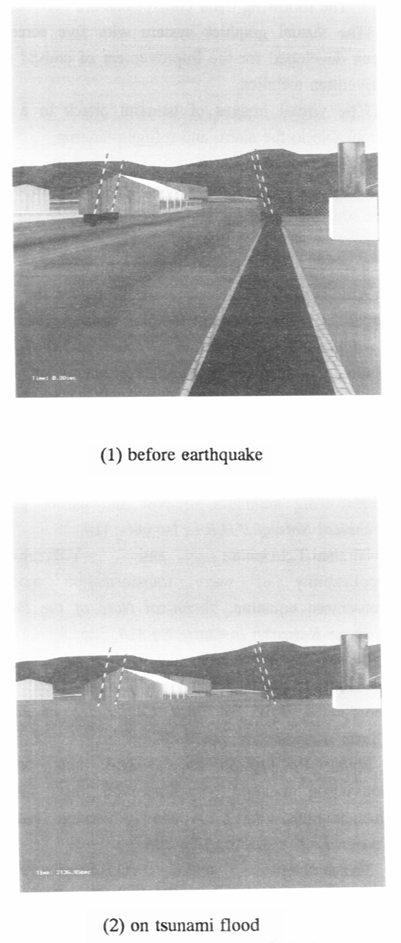
Figure 7 Image on a road of Point2
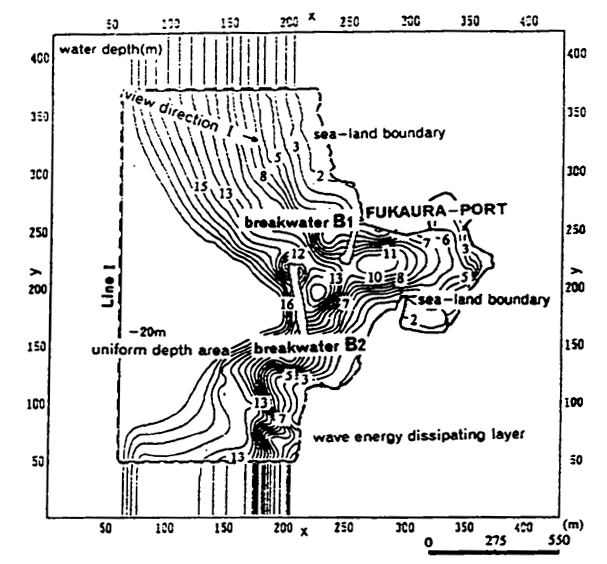
200m long and B2, 300m long to protect the innerharbor from the large waves.
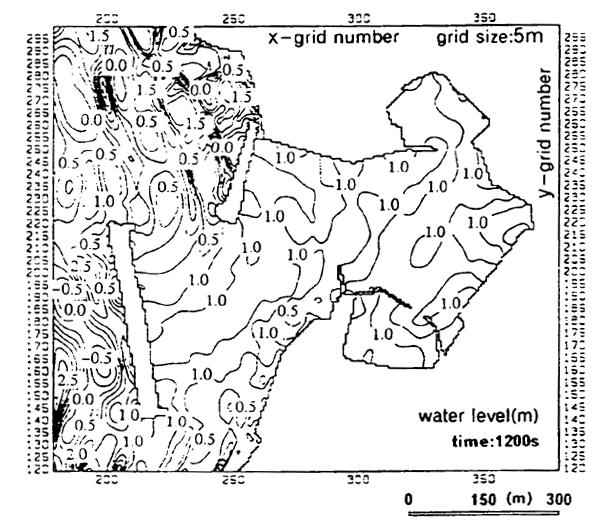
Figure 9 shows the computed water level distribution at t=2000s. The water levels inside the port become much smaller than those outside by the effects of breakwaters. The demonstrated spatial variation of water levels is available to design the port facilities. However, graphics images are more effective to give visual information to the local residents.
(2)Graphics Image
The sea water levels computed at each time step are output into the memory disk. The virtual images are created using the stored water level data. The following figures are copies from the images on the center screen. Figure 10 shows the bird's eye view from the outside of the port. The view direction is indicated by the small arrow in Fig.8. We can clearly understand the total image of wave penetration into the harbor. The wave

Figure 8 Compuation area for Fukaura-port

Figure 9 Computed water level distribution
前ページ 目次へ 次ページ